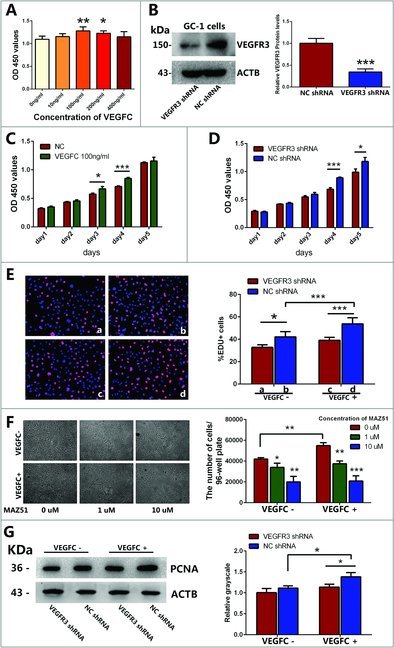
Figure 2.

Effects of VEGFC and its receptor VEGFR3 on the proliferation and DNA synthesis of GC-1 cell line. (A) CCK-8 assay showed the growth of GC-1 cells treated with various kinds of concentrations of VEGFC for 3 days. (B) Western blotting showed the expression levels of VEGFR3 protein in GC-1 cells treated with VEGFR3 shRNA or negative control shRNA. ACTB was used as an internal reference of proteins. (C) The growth of GC-1 cells treated with or without VEGFC for 5 days in CCK-8 assay. (D) The growth of GC-1 cells that were stably transfected with VEGFR3 shRNA or negative control shRNA for 5 days in CCK-8 assay. (E) Representative photomicrographs of EDU-positive cells in GC-1 cells treated with or without 100 ng/ml VEGFC, VEGFR3 shRNA or negative control shRNA. Nuclei were counterstained with DAPI (blue) as shown in the left panel. Statistically significant differences among the percentages of EDU-positive cells were indicated by asterisk as shown in the right columns. The data were presented as mean ± SD of the percentages of EDU-positive cells out of per field (200 ×) in five independent wells. (F) Morphology of GC-1 cells transfected with VEGFR3 shRNA or negative shRNA followed by treatments with different concentrations of MAZ51 under the bright field (100 ×) of microscope. The data were presented as mean ± SD of the number of GC-1 cells collected from five independent wells of 96-wells plate respectively. Scale bar = 20 μm. (G) Western blotting demonstrated the level of PCNA protein in the GC-1 cells transfected with VEGFR3 shRNA or negative shRNA after being treated with or without VEGFC. The right panels displayed the quantification of proteins normalized with ACTB. The data shown in (A-G) were representatives of three independent experiments. (*P<0.05, **P<0.01, ***P<0.001).
