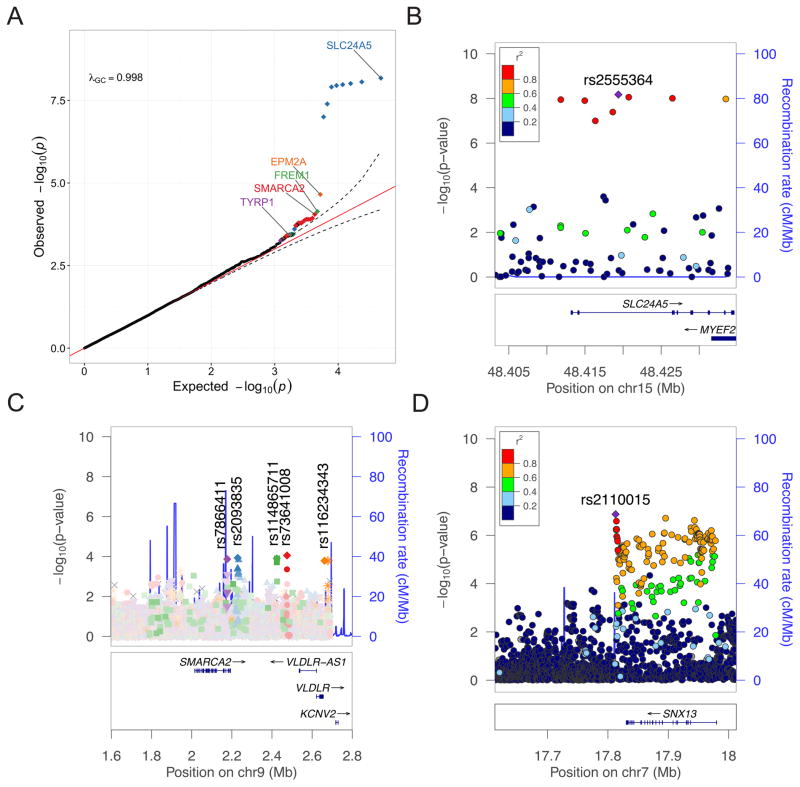
Figure 5. Associations between genetic data and baseline pigmentation.
A) Targeted resequencing QQ plot. 95% confidence interval on the QQ plot is drawn assuming the jth order statistic from a uniform sample follows a Beta(j, n − j + 1) distribution. Colors differentiate loci containing more than one variant associated more significantly than the 95% confidence interval in a region. B–C) LocusZoom plots of targeted resequencing genetic associations incorporating KhoeSan-specific LD. Recombination rates are from HapMap b37. Regions include: B) SLC24A5, and C) 5 independent signals associated with p < 1e-3 in/near SMARCA2 and VLDLR. D) LocusZoom plot of suggestive association in/near SNX13 from meta-analysis of phase 1 and phase2 imputed associations with KhoeSan-specific LD. See also Figure S6, Table S5, Table S7, and Table S6B.

