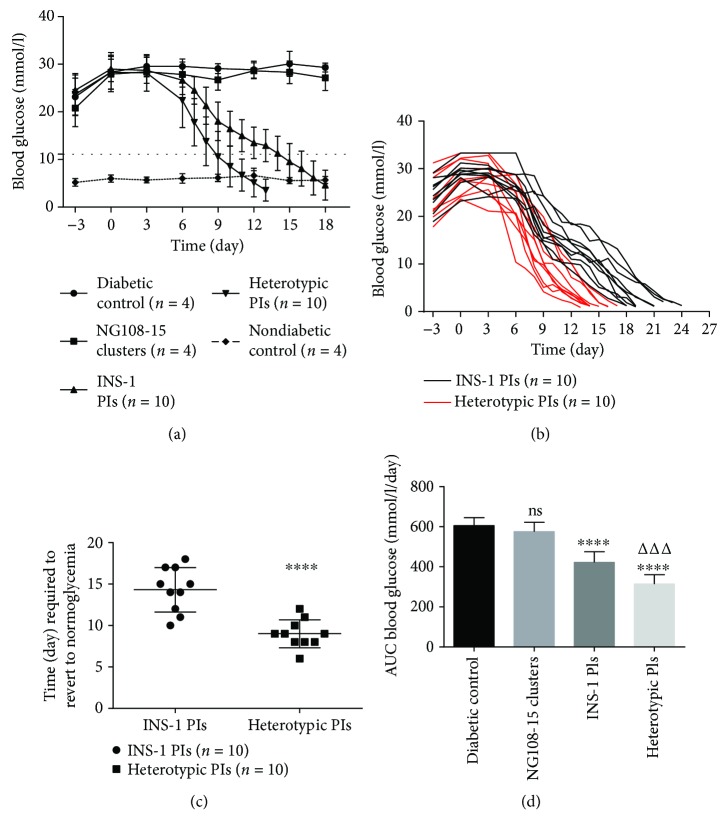
Figure 7.
Subcutaneous pseudoislet transplantation regulates blood glucose levels in STZ diabetic BALB/c nu/nu mice. (a) On day 0, pseudoislets or NG108-15 clusters were injected subcutaneously into the back of nude mice. Values are mean ± SD. The dotted straight line represents 11.1 mmol/l. (b) The blood glucose curves of every mice receiving PIs. The end of curves represents the death of mice. (c) Time (day) required to revert to normoglycemic (<11.1 mmol/l) level after subcutaneous PI transplantation. ∗∗∗∗ p < 0.0001 compared to INS-1 PI group, n = 10. (d) Areas under the blood glucose curve expressed as mmol/l/day. ns compared to diabetic control group. ∗∗∗∗ p < 0.0001 compared to diabetic control group. ΔΔΔ p < 0.001 compared to INS-1 PI group.

