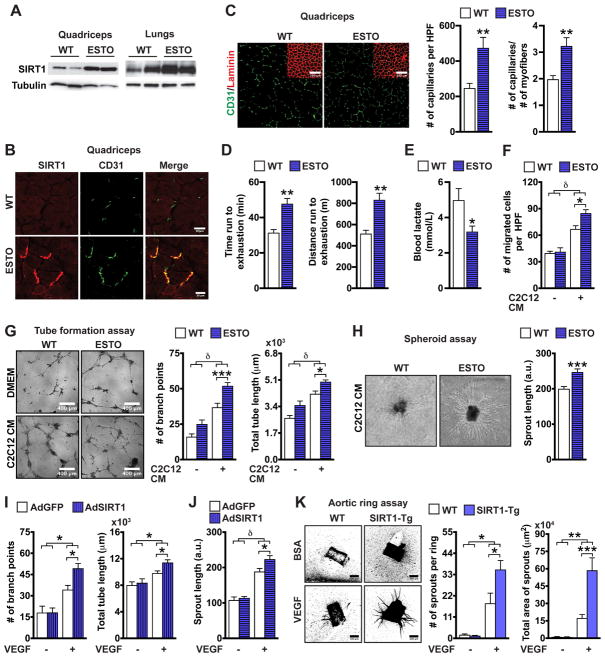
Figure 4. Endothelial SIRT1 increases capillary density and exercise capacity.
(A) SIRT1 protein abundance in quadriceps and lungs. Tubulin serves as a loading control.
(B) Quadriceps sections (@60X) showing SIRT1 and CD31 expression.
(C) Quadriceps sections (@20X) showing CD31 and laminin staining. Number of capillaries and capillary/fiber ratio (6-month old, n = 8).
(D) Duration and distance run until exhaustion in a high intensity treadmill test (6-month old, n = 8).
(E) Post-exercise blood lactate levels (n = 5).
(F) Number of migrated MLECs (n = 10).
(G) Images, number of branch points and length of tube networks formed by MLECs (n = 8).
(H) Images and sprout length of MLEC spheroids (n = 8–9).
(I) Images, number of branch points and length of tube networks formed by HUVECs infected with adenovirus expressing GFP or SIRT1 (n = 8–9).
(J) Sprout length of HUVEC spheroids (n = 8).
(K) Images, number and total area of microvessel sprouts in aortic rings (n = 9).
Data expressed as mean ± SEM. *p < 0.05, **p < 0.005, ***p < 0.0005, δp < 0.00005 by Student’s t test (C–E and H) or two-way ANOVA with Bonferroni’s corrections (F, G and I–K). See also Figure S4 and Movie 2

