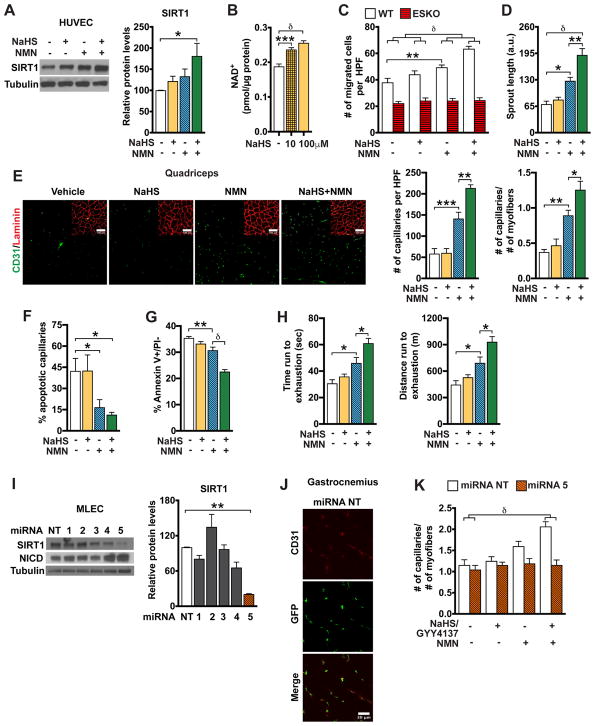
Figure 7. Exogenous hydrogen sulfide activates SIRT1 and augments the effects of NMN.
(A) SIRT1 protein and relative abundance in HUVECs treated for 24 hrs (n = 4).
(B) NAD+ levels in HUVECs treated for 24 hrs (n = 6).
(C) Number of migrated MLECs stimulated with C2C12 CM for 12 hrs (n=15).
(D) Sprout length of VEGF-stimulated HUVEC spheroids (n = 7).
(E) Quadriceps sections (@20X) showing CD31 and laminin staining. Capillary number and capillary/myofiber ratio (32-month old, n = 7).
(F) Percent TUNEL+ capillaries in quadriceps sections (32-month old, n = 5).
(G) Number of apoptotic HUVECs (Annexin V+/PI−) following exposure to H2O2 (n = 12).
(H) Duration and distance run until exhaustion in a low intensity treadmill test (32-month old, n = 7).
(I) SIRT1 and NICD proteins in MLECs transduced with lentiviruses expressing NT or SIRT1 miRNAs (miRNA # 1–5). Relative SIRT1 protein abundance (n = 3).
(J) Images of gastrocnemius sections (@40X) immunostained with EGFP and CD31 from WT mice injected with lentiviral particles that transduced EGFP and NT miRNA.
(K) Capillary/myofiber ratio in the gastrocnemii of mice infected with lentiviral particles transducing NT or SIRT1 # 5 miRNA (n = 6).
Data are expressed as mean ± SEM. *p < 0.05, **p < 0.005, ***p < 0.0005, δp < 0.00005 by Student’s t test (I), one-way (A–B and D–H) or two-way (C and K) ANOVA with Bonferroni’s corrections. See also Figure S7 and Table S1

