Figure 5.
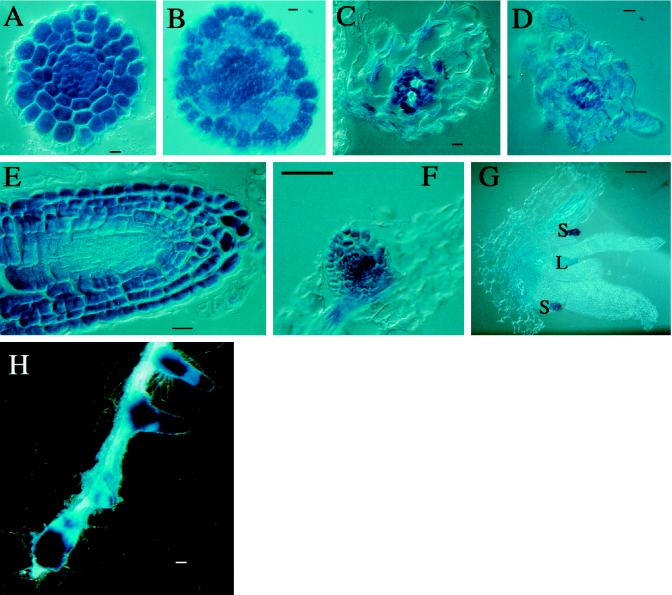
Cell-specific expression in AtVLN 1::GUS (A, C, E, and G) and AtVLN 2::GUS (B, D, and F) transgenic plants. A and B, Cross-sections of root tips. C and D, Cross-sections through adult root. E, Longitudinal section of root tip. F, Longitudinal section of lateral root bud. G, Section through apical meristem; S, stipules; L, leaf primordium. GUS staining was performed for 16 h. H, Staining of a root of an AtVLN 1::GUS plant. Two days after treatment with 2,4-D, GUS staining was performed for 2 h. Scale bars represent 10 μm in A through E and 100 μm in F through H.

