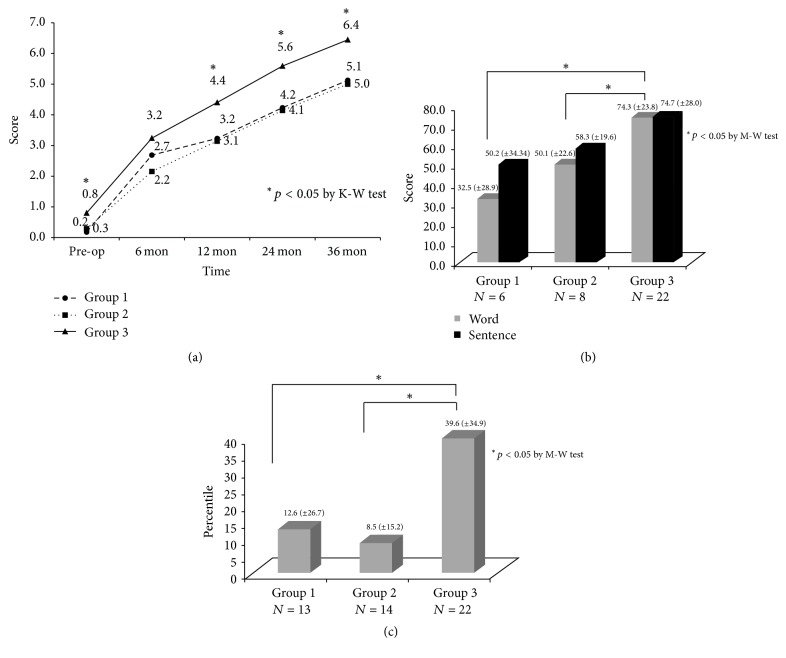
Figure 2.
Comparisons of post-CI speech performance between three groups. ∗ means statistically significant. (a) CAP score. Since 12 months after CI, Group 3 showed significantly better outcomes than Groups 1 and 2. (b) Open-set score. Groups 1 and 2 showed less favorable results. (c) Picture vocabulary tests.

