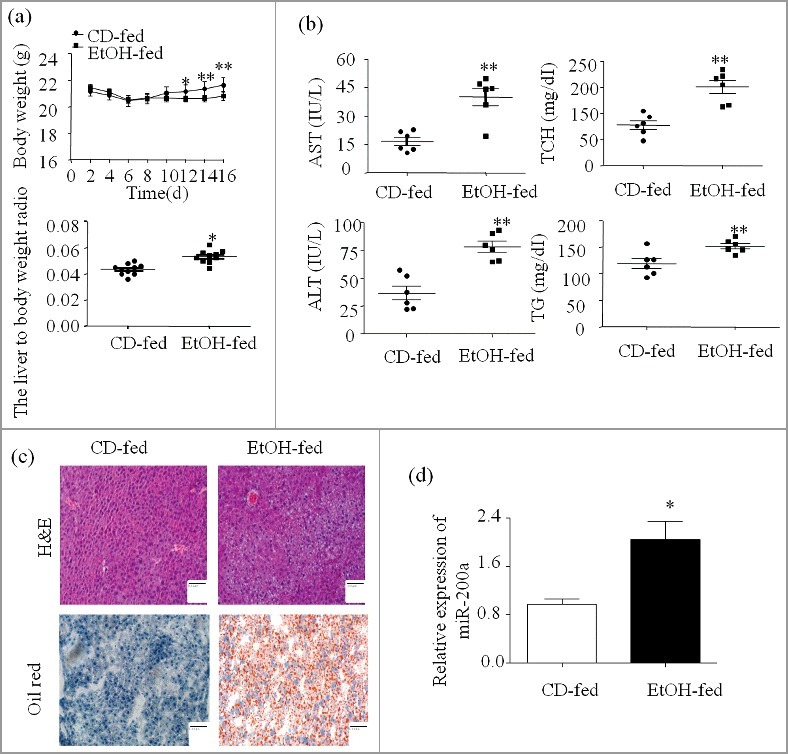
Figure 1.

MiR-200a is up-regulated in mice after chronic and binge ethanol feeding. (a) The integrated liver tissue was separate from sacrificed mice. Body weights and the liver to body weight ratio after ethanol feeding. (b) Serum AST, ALT, Hepatic TG, TCH levels. (c) Representative views of H&E staining and Oil Red O staining (original magnification, ×20). (d) Total miR-200a were isolated from the primary hepatocyte and were analyzed by qRCR. The results are shown as relative expression against control expression without treatment. The values represent means ± SD (n = 6 in CD-fed group, n = 6 in EtOH-fed group). * P < 0.05, ** P < 0.01 versus control.
