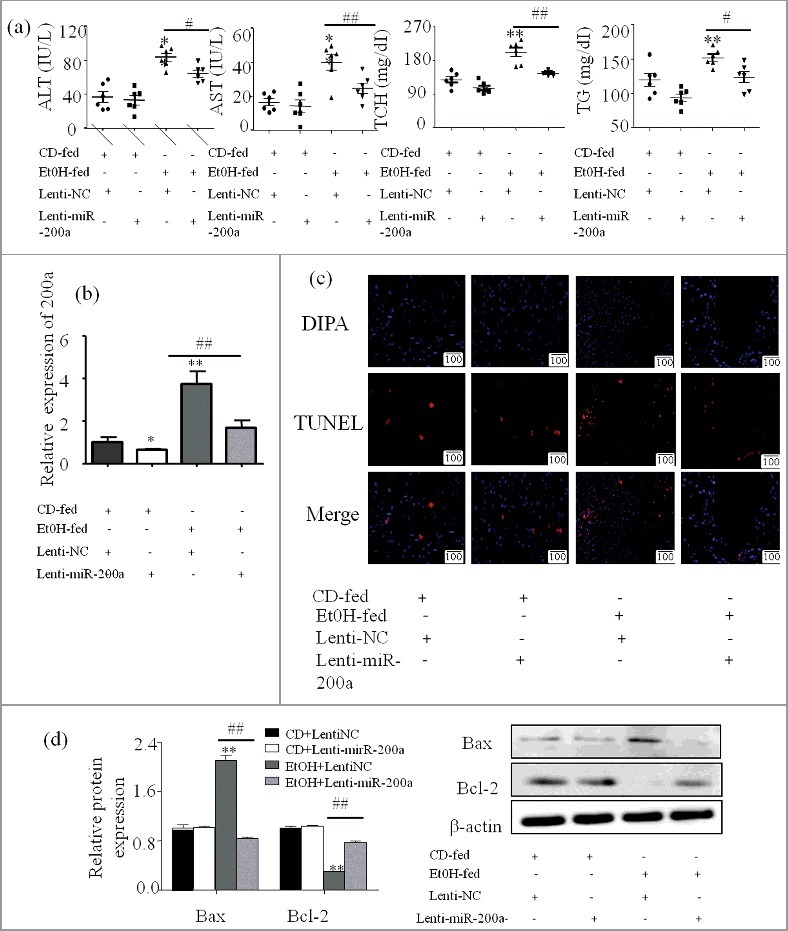
Figure 3.

miR-200a induced hepatocyte apoptosis in vivo (a) Serum AST, ALT, Hepatic TG and TCH levels were calculated to evaluate the degree of liver injury. (b) Effect of injected letivirus in mice was evaluated by alteration of miR-200a expression. MiR-200a expression in different groups was analyzed by qPCR. The results are shown as relative expression against control expression without treatment. The values represent means± SD (n = 3 in CD-fed group, n = 3 in EtOH-fed group). (c) The apoptosis cells staining with TUNEL were visualized with a fluorescence microscope (original magnification, ×20). (d) The expression of Bax and Bcl-2 upon treatment with ethanol was determined by western blot in primary hepatocyte derive from experiment mice. The results are shown as relative expression against control expression without treatment. Data shown are the mean± SD from 3 independent experiments. ** P < 0.01 versus control. # P< 0.05, ## P< 0.01 versus ethanol treatment group.
