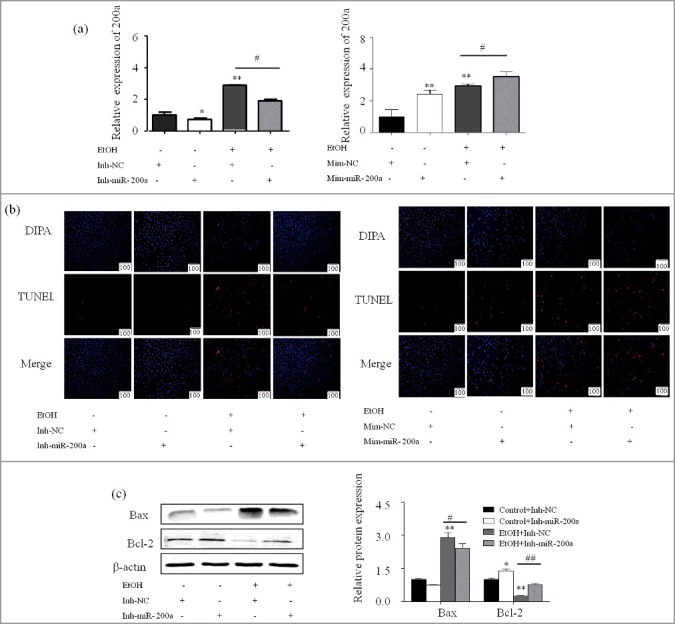
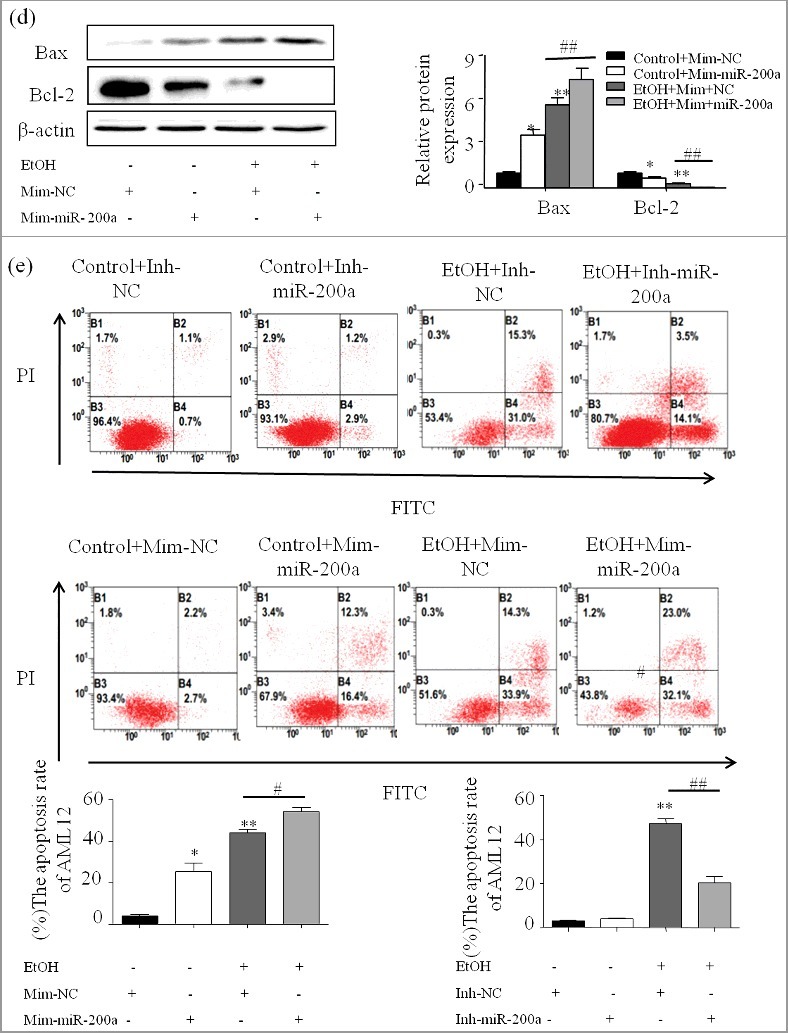
Figure 4.

miR-200a induced hepatocyte apoptosis in vitro.
(a) qPCR showed that transfect miR-200a inhibitor and mimics decrease or increase the expression of miR-200a in AML-12 cells. The results are shown as relative expression against control expression without treatment. Data were presented as mean ± SD from three independent experiments. (b) Representative photomicrographs of group data for TUNEL positive cells (original magnification, × 20). (c) The protein expression of Bax and Bcl-2 were analyzed by western blot in Inh-miR-200a or Mim-miR-200a transfected ethanol-induced AML-12 cells. The results are shown as relative expression against control expression without treatment. Data shown treatment are the mean ±SD from 3 independent experiments. (d) The number of apoptosis cells were presented by flowcytometry using AnnexinV- PI staining. Values are mean ± SD of data from three experiments. * P < 0.05, ** P < 0.01 versus control. # P< 0.05, ## P<0.01 versus ethanol treatment group, ns, not significant versus ethanol treatment group.

