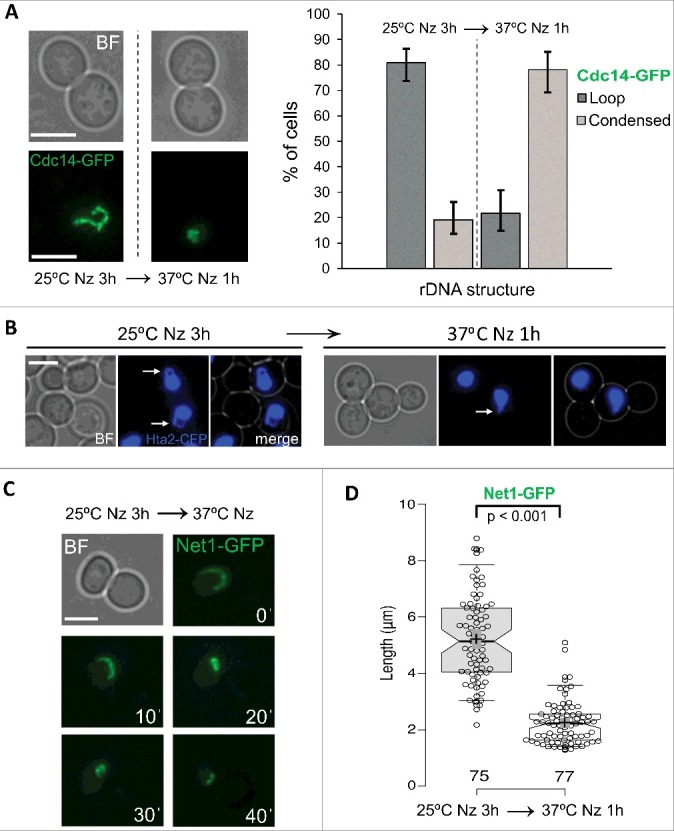
Figure 1.

The rDNA metaphase loop gets condensed upon heat stress (HS). (A) Strain FM230 (CDC14:GFP, YPH499 background) was blocked in metaphase with Nocodazole (Nz) for 3h at 25 ºC and then shifted to 37 ºC for 1 h. Samples were taken and visualized under the fluorescence microscope before and after the temperature shift. Representative photos are shown on the left and a quantification chart on the right. (B) Strain yED233 (HTA2:yEmCFP) was Nz-blocked at 25 ºC and then shifted to 37 ºC for 1 h. Representative photos are shown before and after the temperature shift. White arrows point to the metaphase loop seen with the HTA2-CFP histone signal. (C) Strain FM225 (NET1:GFP, YPH499 background) was Nz-blocked for 3h at 25 ºC before being sawed onto an agarose patch with Nz and filmed while cells were being heated up to 37 ºC. A representative cell filmed in 10 min intervals during this HS time-lapse is shown. (D) Strain FM931 (OsTIR1 NET1:GFP, W303 background) was Nz-blocked at 25 ºC and then shifted to 37 ºC for 1 h. Box plot of the quantification of the length of the loop, the line or the major axis of the oval shape (when neither a loop nor a line could be inferred) before and after the HS. White scale bars represent 5 μm. BF, bright field; Nz, nocodazole.
