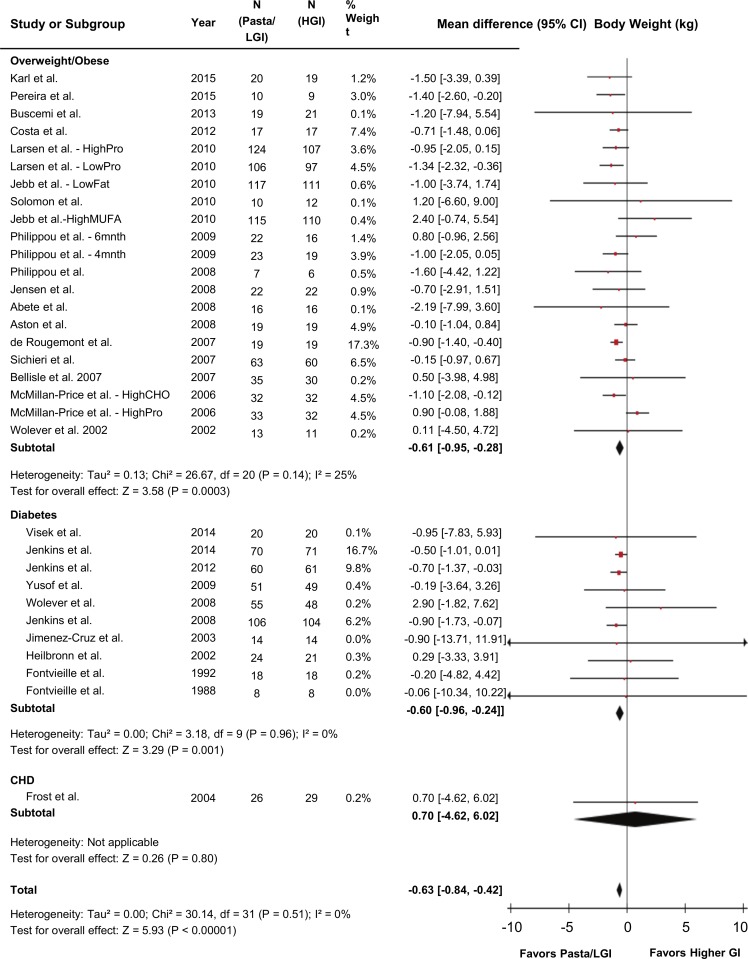
Figure 2.
Forest plot of randomised controlled trials investigating the effects of pasta in the context of low-GI dietary patterns on body weight (kg). n=2448. Data are expressed as mean differences represented by a square and 95% CIs by the line through the square. 95% CIs exceeding the plot’s bounds are represented by an arrowhead. Pooled effect estimates are represented by diamonds and were estimated with the use of generic inverse variance random effects models. Between-study heterogeneity was assessed by the Cochran Q statistic, where P<0.10 is considered statistically significant, and quantified by the I2 statistic, where I2≥50% is considered evidence of substantial heterogeneity. CHD, coronary heart disease; CHO, carbohydrate; GI, glycaemic index; HGI, higher-glycaemic index diet; LGI, low-glycaemic index diet; MUFA, monounsaturated fatty acid; Pro, protein.

