Figure 1.
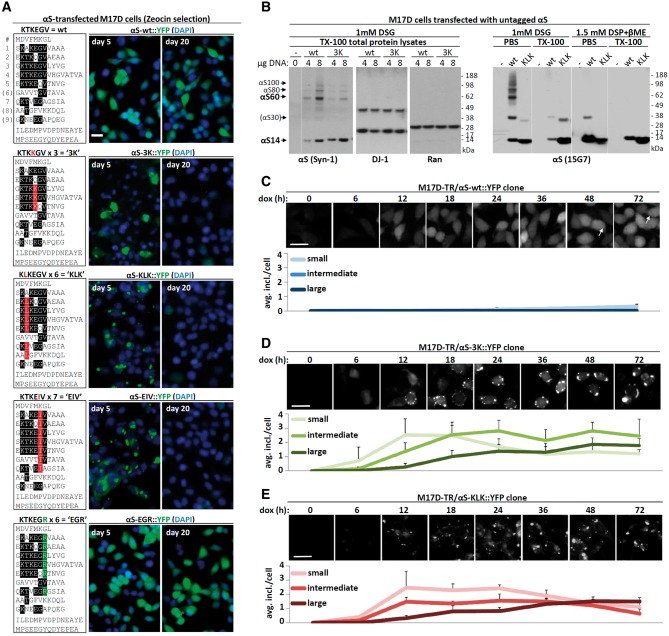
αS inclusion dynamics. (A) Schematics of wt αS and repeat-motif mutants by aligning aa sequences via the repeat consensus sequence KTKEGV. Middle and right panels: immunofluorescent images (YFP, green; DAPI, blue), live cells, 5 and 20 days after transfection of M17D neuroblastoma cells with the indicated αS::YFP variants followed by Zeocin selection. Scale bar, 20 µm. (B) wt vs. 3K, and wt vs. KLK αS were transiently expressed in M17D cells for 48 h followed by DSG intact-cell cross-linking and Western blot (WB). As a control, mock-transfected cells (-) are shown. Two different DNA amounts (4 and 8 µg per 6-cm dish, respectively) were transfected in the case of wt vs. 3K (left panels), total protein lysate and blots were developed for αS (mAb Syn-1), DJ-1 (dimeric protein, positive control/loading control) and Ran (monomeric protein, negative control/loading control). Wt vs. KLK (right panels, mAb 15G7) was analyzed by sequential extraction (PBS fraction, ∼cytosol; TX-100 fraction) and adding DSP/βME-reversed crosslinking (see Methods) to visualize total αS amounts. Note that, consistent with earlier data, we sometimes observe αS30 putative dimers upon transient overexpression, while apparent trimers are typically absent. Data represent at least 10 independent experiments. Membranes were cut as indicated by thin white lines. (C) Time-course of αS-wt::YFP induction in a clonal cell line. M17D cells expressing YFP-tagged αS 3K (dox-inducible) were induced for the indicated time points (all cells plated at the same time, but induced at different time points), then fixed (4% paraformaldehyde) and imaged. Only very few smaller inclusions (<2 µm) were observed, mostly at later time points. This and subsequent graphs based on three independent cultures, 20 cells each. Scale bar, 20 µm. (D) Time-course of αS-3K::YFP induction in a clonal cell line. M17D cells expressing YFP-tagged αS3K (dox-inducible) were induced for the indicated time points, then fixed (4% paraformaldehyde) and imaged. Over time, the number of medium (1–2 µm diameter) and large (>2 µm) inclusions increased, at the expense of small inclusions (<1 µm). Scale bar, 20 µm. (E) Analogous to (D), but αS-KLK::YFP.

