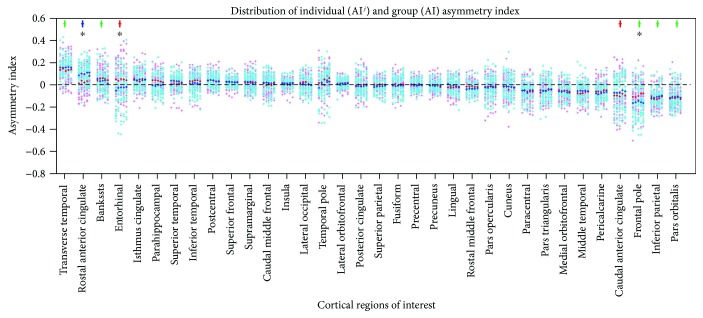
Figure 2.
Distribution of individual and group asymmetry indices for 34 cortical regions. For each region, a column represented indices of one visit. Pink and red dots, respectively, represented individual and intragroup mean asymmetry indices of MCI nonconverters. Cyan and blue dots, respectively, represented individual and intragroup mean asymmetry indices of converters. Colored crosses denoted that significant asymmetry was observed in the corresponding region in either or both groups, where red crosses denoted significant asymmetry in nonconverters, blue denoted asymmetry in converters, and green denoted asymmetry in both groups. Black asterisks denoted that significant between-group difference was observed in the corresponding region. Bankssts: banks of the superior temporal sulcus.

