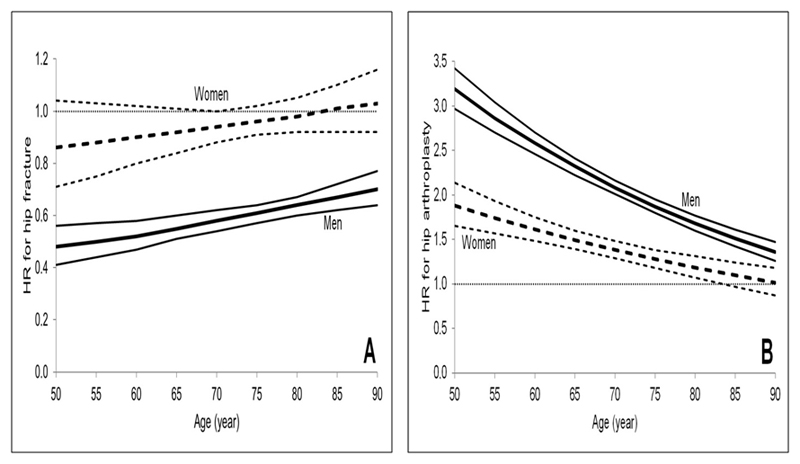
Figure 1.
Risk of hip fracture and hip arthroplasty for farmers according to age for hip fracture on left panel (A) and hip arthroplasty on right panel (B). HR and 95% confidence interval adjusted for age, time since baseline, income, education, latitude and population density. Black lines denotes men and dotted lines denotes women. The horizontal dotted line is y=1. If HR is 1 there is no effect of risk factors for risk of endpoint.

