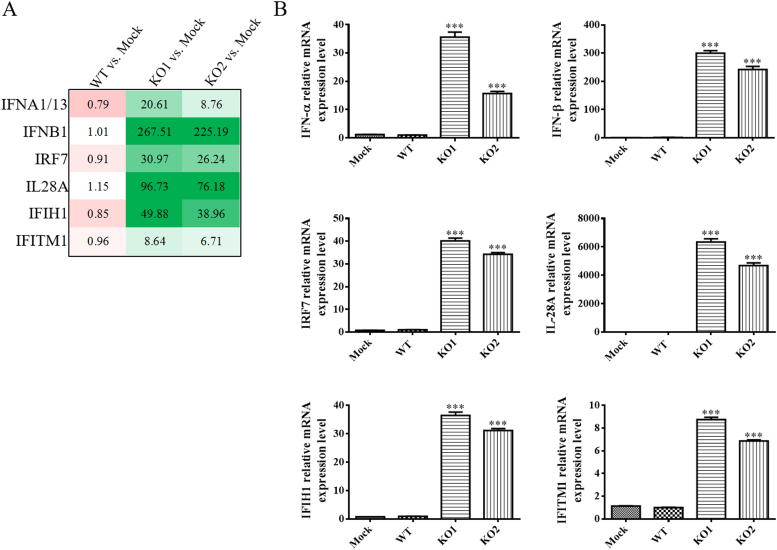
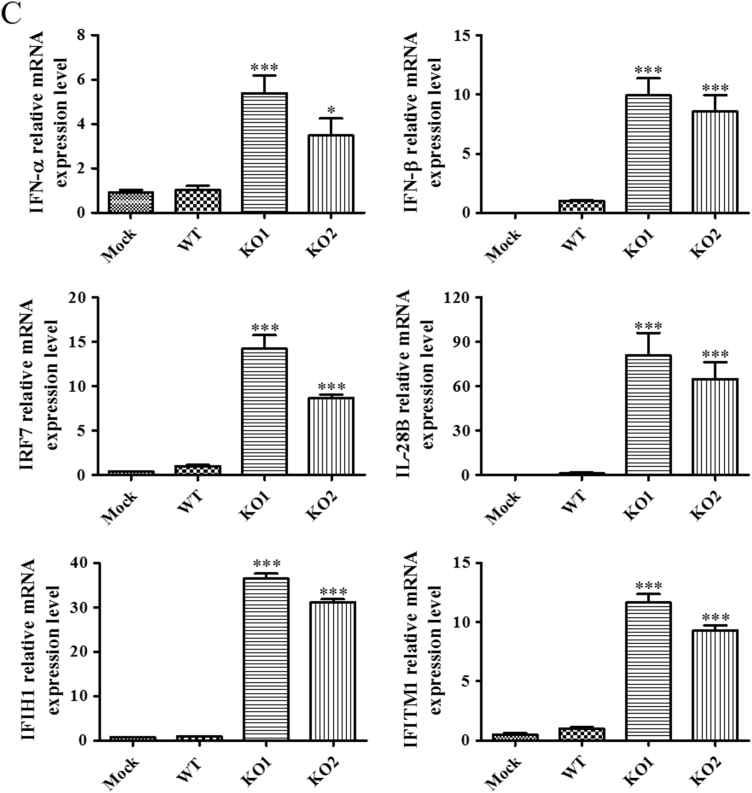
Fig. 5.
Quantitative RT-PCR detection of the expression of selected differentially expressed genes in virus-infected cells. (A) Six selected immune genes with increased expression levels in cells infected by nsp2TF/nsp2N-deficient mutants. Each data point shown represents the mean value from five replicates, and the gene expression levels in mock were treated as 1. (B) The relative expression levels of six immune genes in virus-infected MARC-145 cells at 12 hpi. (C) The relative expression levels of six immune genes in virus-infected PAM at 12 hpi. (B-C) Each data point shown represents the mean value from five replicates, and the gene expression levels in WT infected cells were treated as 1.


