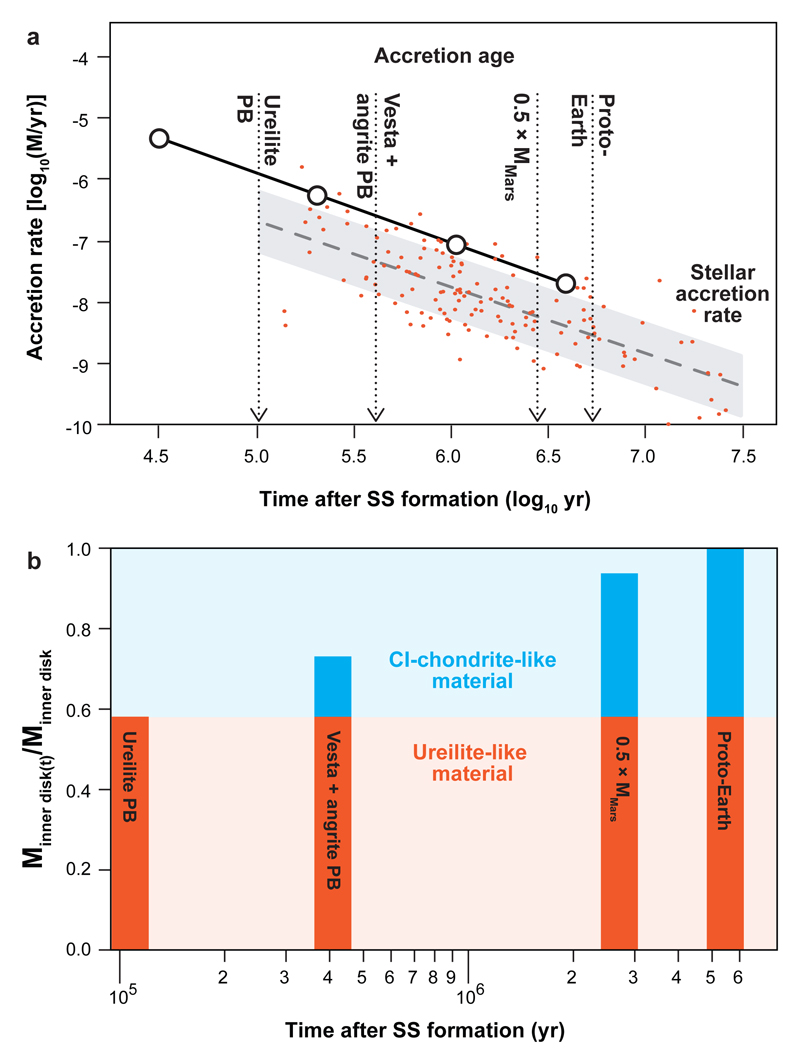
Fig. 3. Accretion rate of inner disk mass versus time.
Shown in (A) are the calculated accretion rates of the inner protoplanetary disk inferred from μ48Ca composition and maximum accretion timescales of planetary bodies (white circles), assuming the μ48Ca signature is representative of the entire inner disk mass at that time. Thus, the accretion rate of the inner protoplanetary disk reflects the amount of mass locked into bodies at any given time relative to the final disk mass, which is taken as the mass of asteroids, moons and planets located sunward of Jupiter (see methods). Given the apparent power law decline in our calculated accretion rates, we show the calculated values at Δlog(t)/2 of their respective time interval. For comparison, we also show observed stellar accretion rates and the empirical accretion rate scaled to a 0.7 solar mass star versus time23. In (B), we show the proportion of mass locked into asteroids, embryos and planets at their maximum accretion age assuming that each parent body composition is representative of the bulk disk composition at the time of their accretion. The proportions are calculated as mixtures between a ureilite-like 48Ca composition and outer Solar System dust represented by CI chondrites (see methods).

