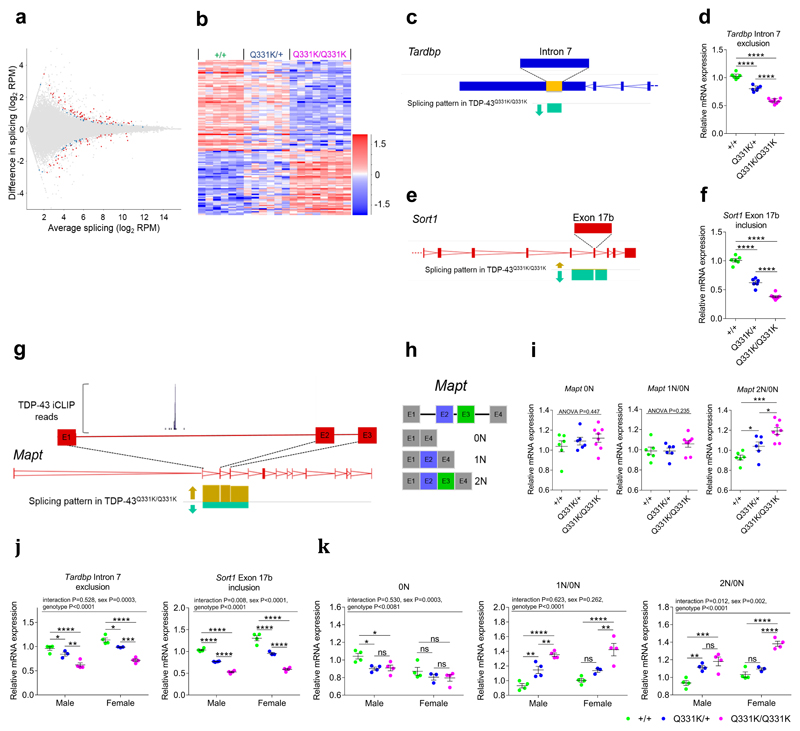
Figure 5. Splicing analysis indicates TDP-43 misregulation, a gain of TDP-43 function and altered Mapt exon 2/3 splicing.
(a) MA plot and (b) hierarchical clustering of frontal cortical alternative splice events (n = 6 wild-type, 6 TDP-43Q331K/+, 8 TDP-43Q331K/Q331K mice). Comparison: DESeq2 wild-type v TDP-43Q331K/Q331K.
(c) Schematic of altered splicing in the 3’UTR of Tardbp. Arrow indicates reduced exclusion of intron 7 of the Tardbp transcript in TDP-43Q331K/Q331K relative to wild-type mice.
(d) Quantitative PCR (qPCR) of splicing changes in Tardbp intron 7 (n = 6 wild-type, 6 TDP-43Q331K/+, 8 TDP-43Q331K/Q331K mice).
(e) Schematic of exon 17b inclusion/exclusion in Sort1. Arrows indicate reduced inclusion of exon 17b in TDP-43Q331K/Q331K relative to wild-type mice.
(f) qPCR of splicing changes in Sort1 exon 17b (n = 6 wild-type, 6 TDP-43Q331K/+, 8 TDP-43Q331K/Q331K mice).
(g) Schematic of altered splicing of exons 2 and 3 of Mapt. Arrows indicate increased inclusion of exons 2 and 3 in the Mapt transcripts of TDP-43Q331K/Q331K relative to wild-type mice. The expanded view of exon 1 to exon 2 includes a site of TDP-43 binding as detected by iCLIP (iCount pipeline; TDP-43_CLIP_E18-brain).
(h) Schematic of N-terminal Mapt splice variants (0N, 1N and 2N).
(i) qPCR of splicing changes in Mapt exons 2 and 3 (n = 6 wild-type, 6 TDP-43Q331K/+, 8 TDP-43Q331K/Q331K mice). 2N/0N pairwise comparisons: wild-type vs. TDP-43Q331K/+: P=0.047 (*); wild-type vs. TDP-43Q331K/Q331K: P=0.0001 (***); TDP-43Q331K/+ vs. TDP-43Q331K/Q331K: P=0.013 (*).
(j-k) qPCR of hippocampal splicing changes (n = 4 wild-type, 3 TDP-43Q331K/+, 4 TDP-43Q331K/Q331K mice per gender). Pairwise comparisons: Tardbp intron 7 exclusion, male: wild-type vs. TDP-43Q331K/+: P=0.043 (*); TDP-43Q331K/+ vs. TDP-43Q331K/Q331K: P=0.002 (**); female: wild-type vs. TDP-43Q331K/+: P=0.013 (*); TDP-43Q331K/+ vs. TDP-43Q331K/Q331K: P=0.0002 (***); Mapt: 0N, male: wild-type vs. TDP-43Q331K/+: P=0.023 (*); wild-type vs. TDP-43Q331K/Q331K: P=0.023 (*); TDP-43Q331K/+ vs. TDP-43Q331K/Q331K: P=0.877 (ns); female: wild-type vs. TDP-43Q331K/+: P=0.365 (ns); wild-type vs. TDP-43Q331K/Q331K: P=0.324 (ns); TDP-43Q331K/+ vs. TDP-43Q331K/Q331K: P=0.858 (ns); 1N/0N, male: wild-type vs. TDP-43Q331K/+: P=0.008 (**); TDP-43Q331K/+ vs. TDP-43Q331K/Q331K: P=0.008 (**); female: wild-type vs. TDP-43Q331K/+: P=0.077 (ns); TDP-43Q331K/+ vs. TDP-43Q331K/Q331K: P=0.002 (**); 2N/0N, male: wild-type vs. TDP-43Q331K/+: P=0.002 (**); wild-type vs. TDP-43Q331K/Q331K: P=0.0001 (***); TDP-43Q331K/+ vs. TDP-43Q331K/Q331K: P=0.151 (ns); female: wild-type vs. TDP-43Q331K/+: P=0.202 (ns).
For (d,f,i-k) P<0.0001 (****). For (d,f,i) one-way and (j,k) two-way ANOVA, all followed by Holm-Sidak post-hoc tests for pairwise comparisons.
Error bars denote s.e.m.

