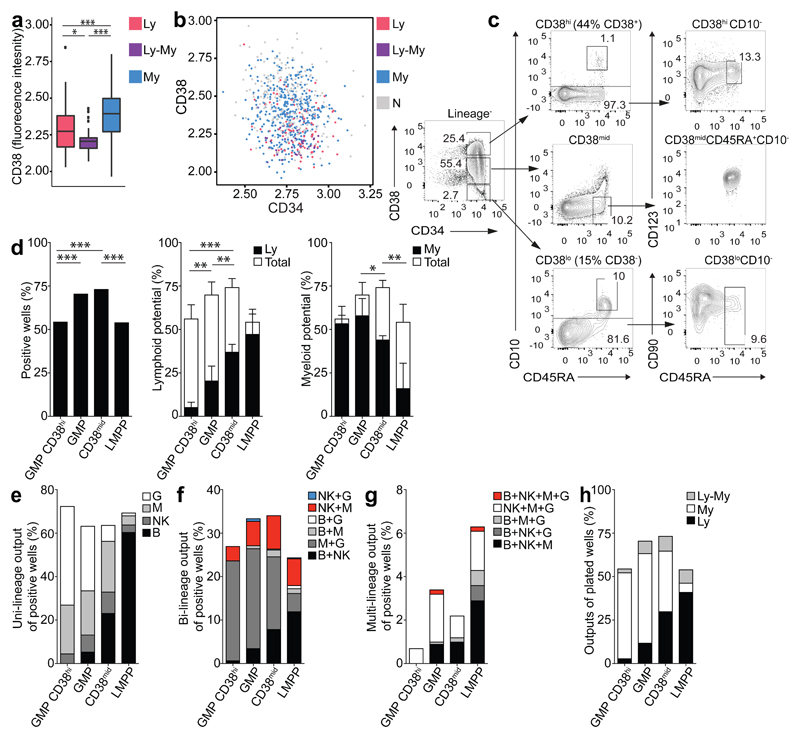
Figure 7. New flow cytometric sorting strategy to purify functional potential within CB GMP compartment.
(a) Logicle transformed CD38 surface marker expression levels in GMPs, grouped by functional output. n=5 CB donors. (b) CD38 and CD34 levels in GMPs colored by output from functional assays. Data are from 5 CB donors. (c) Revised sorting strategy, based on CD38 expression levels defined by bioinformatic analysis. Representative plots from 4 CB donors. (d) Total cloning efficiency (left) of the single GMP CD38hi, GMP, CD38mid and LMPP (GMPhi: 152/279 cells, CD38mid: 508/693). Significance defined using Fisher’s exact test. Cloning efficiency of lymphoid (Ly, middle) and myeloid lineages (My, right) of single cell GMP CD38hi, GMP, CD38mid and LMPP. Bars indicate total cloning efficiency; filled portion indicates the proportion of lymphoid (lymphoid plus mixed) or myeloid potential (myeloid plus mixed clones). Mean ± SD is shown. Significance is defined using students t-test. (e) Single-, (f) bi- and (g) multi-lineage outputs from single cells, presented as percentage of the positive wells. (h) Lymphoid (Ly), myeloid (My) and lympho-myeloid (Ly-My) outputs presented as a percentage of all plated GMP CD38hi, GMP, CD38mid and LMPP cells. For the functional assays (d-h), data are from 4 CB donors, for LMPP and GMP controls data are from 22 CB donors (the same shown in Fig. 2a-e).

