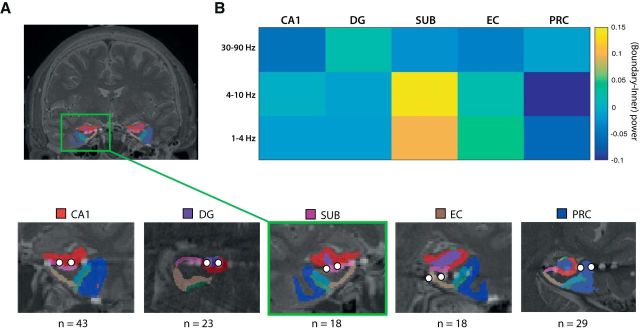
Figure 2.
A, Electrodes were localized by combining presurgical high-resolution structural MRI and postimplant CT scans. The hippocampal subregions are labeled and shaded in color and the bipolar electrode contact pairs (distance 1.5 mm) centered at each subregion are marked with white dots. Images are from Patient 1066P. B, Encoding boundary locations elicited higher power in low-frequency oscillations than inner locations. Z-scored power differences between boundary and inner target locations are plotted for three frequency bands: low-theta (1–4 Hz), theta (4–10 Hz), and gamma (30–90 Hz). There was a significant boundary × frequency interaction that was specific only to the subiculum (F(2,34) = 4.71, p = 0.016) and present in no other region.

