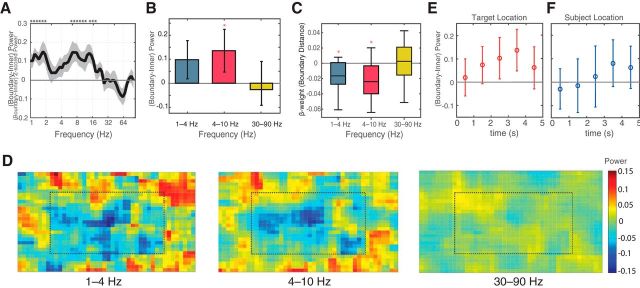
Figure 3.
A, Power–frequency plot of normalized power differences in the subiculum between boundary and inner target locations. Asterisks indicate parts of the spectra where boundary and inner trials significantly differ (t tests at each frequency, p < 0.05). B, Boundary–inner power difference in three frequency bands: low-theta (1–4 Hz), theta (4–10 Hz), and gamma (30–90 Hz). Error bars indicate 95% confidence intervals. Targets near boundaries elicit stronger theta oscillations than those far from boundaries. C, Mean β coefficients for best fit lines predicting power by distance to the nearest boundary across all hemispheric measurements. Asterisks indicate statistically significant difference from 0. D, Overhead heatmaps of the environment plotting average z-scored power for the three observed frequency bands at each target object location. The environment was binned into a 45 × 30 rectangular grid and computed average power in each bin for each subicular sample. Individual heat maps were smoothed with a 2D Gaussian kernel (width = 7) and then averaged across all samples. Dotted lines indicate the boundary–inner division. E, Boundary–inner theta power across the 5 s of encoding with respect to the target location. F, Boundary–inner theta power across the 5 s of encoding, with respect to the subject location (right). Error bars indicate 95% confidence intervals.

