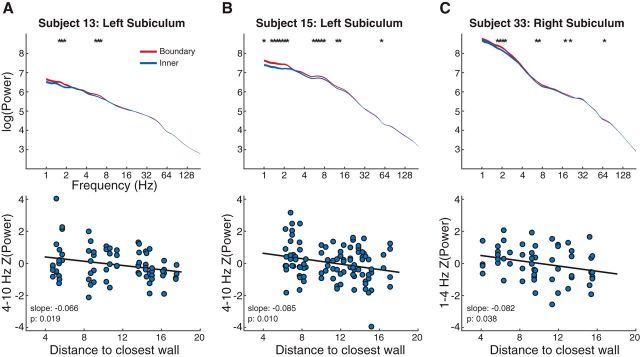
Figure 4.
A–C, Each column shows an individual electrode from three different subjects. First row, Examples of power spectra from individual electrodes for boundary and inner trials. Line thickness indicates SE. Asterisks indicate parts of the spectra where boundary and inner trials significantly differ (t tests at each frequency, p < 0.05). Second row, Trial-by-trial plot of power in theta frequency oscillations for each corresponding electrode above it. Slopes of the best fit lines that negatively deviate from zero show that theta power is stronger at closer distances to a wall boundary.

