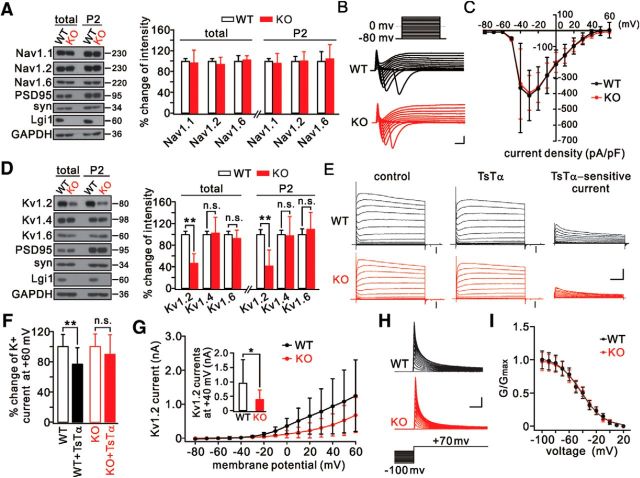
Figure 2.
Downregulation of Kv1.2 in LGI1−/− (KO) mice. A, Temporal cortical lysates (total) and synaptic fractions (P2) from WT and KO mice probed with antibodies to Nav1 channels and LGI1. Total and P2 fraction of Nav1 were normalized to the corresponding GAPDH, and percentage changes relative to WT are plotted in the histogram. n = 5/group. B, Whole-cell INa in temporal pyramidal neurons from P14–P17 WT (n = 18) and KO (n = 20) mice elicited by voltage steps from −80 to 60 mV in 10 mV increments from a holding potential of −80 mV. Calibration: 2 nA, 1 ms. C, INa peak currents normalized to the corresponding cell capacitances (current density). D, Temporal cortical total and P2 fractions from WT and KO mice (P16) normalized to corresponding GAPDH, and percentage changes relative to WT are plotted in the histogram. n = 6/group. E, K+ currents evoked by voltage-clamp pulses (−80 mV to 60 mV) in WT and KO pyramidal neurons before and after TsTα application (100 nm). Right, Kv1.2 currents (TsTα-sensitive currents) obtained by current subtraction. Neurons were perfused with TTX (1 μm)-containing aCSF. Black arrows indicate seal tests. Calibration: 2 nA (total currents), 1 nA (subtracted currents), 100 ms. F, Percentage changes in the amplitudes of K+ currents evoked at 60 mV. WT: 100 ± 14%, n = 24. WT+TsTα: 77 ± 24%, n = 24. KO: 100 ± 19%, n = 23. KO+TsTα: 90 ± 28%, n = 23. G, Plots of current–voltage relationships (I–V curves) of Kv1.2 currents. Inset, Averaged Kv1.2 currents at 40 mV (WT: 950 ± 816 pA, n = 24; KO: 388 ± 333 pA, n = 23). H, Inactivation of Kv1.2 currents in WT and KO neurons tested with 3 s inactivating pre-pulses. Calibration: 1 nA, 2 ms. I, Lines represent Boltzmann fits yielding half-activation midpoints of −42.5 mV (WT) and −41.7 mV (KO) and slope factors of 16.7 (WT) and 16.0 (KO). WT, n = 15; KO, n = 13. *p < 0.05, **p < 0.01.

