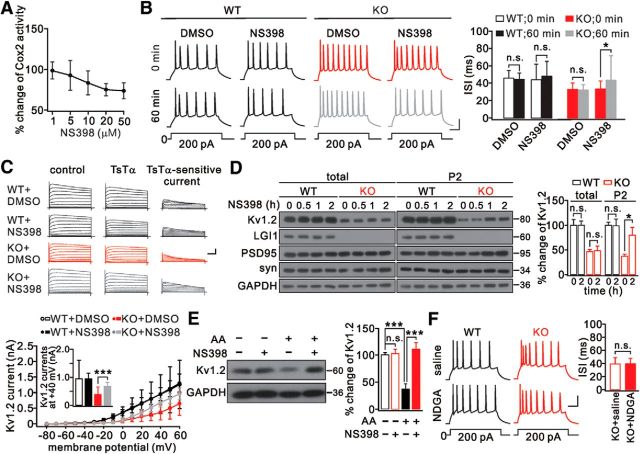
Figure 4.
Cox2 inhibition restored Kv1.2. A, Dose–response curve for the effect of NS398 on Cox2 activity in LGI1−/− (KO) cortical slices. Data are presented as percentage change relative to the untreated group. n = 5/group. B, Spikes were induced every 5 min in WT and KO layer 2/3 neuron perfused with aCSF containing DMSO or NS398 (20 μm). Calibration: 20 mV, 50 ms. Right, ISIs. C, K+ currents evoked by voltage-clamp pulses (−80 to 60 mV) in WT and KO neurons before and after addition of TsTα (100 nm). Right, Kv1.2 currents were obtained by current subtraction. Calibration: 2 nA (total currents) or 1 nA (subtracted currents), 100 ms. Bottom, I–V curves of Kv1.2 currents. Inset, Averaged Kv1.2 currents at 40 mV (WT+DMSO: 950 ± 639 pA, n = 16; WT+NS398: 949 ± 208 pA, n = 19; KO+DMSO: 381 ± 252 pA, n = 16; KO+NS398: 682 ± 140 pA, n = 17). D, Levels of Kv1.2, PSD95, synaptophysin (syn), and LGI1 in cortical slices with NS398 (20 μm) at different time points. For each time point, 5 slices from WT or KO mice were used. GAPDH was the loading control. Right, Percentage changes of Kv1.2 relative to WT during NS398 treatment. E, AA (20 μm) decreased, but NS398 (20 μm) reversed, Kv1.2 expression in cultured cortical neurons (DIV 14). GAPDH was the internal control. Histogram represents the percentage change of Kv1.2 relative to control (AA−/NS398−) after 48 h treatment. AA−/NS398−: 100 ± 4%; AA−/NS398+: 102 ± 8%; AA+/NS398−: 35 ± 10%; AA+/NS398+: 111 ± 12%. n = 5/group. F, Spikes and ISIs of layer 2/3 pyramidal neurons from WT and KO mice in response to prolonged current injection and exposed to NDGA (50 μm). *p < 0.05, ***p < 0.001.

