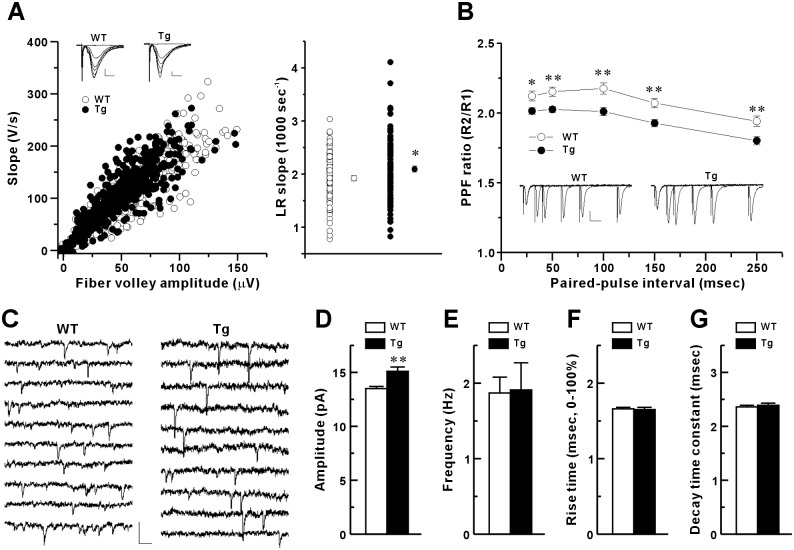
Fig 3. Basal physiological properties of hippocampal CA1 synapses in IP3K-A Tg young mice.
(A), Input-output relationship of basal evoked synaptic transmission. Left, the field EPSP slopes were measured in response to six-step incremental stimulus current intensity per hippocampal slice. Scale bars: 0.5 mV, 5msec. Right, linear regression (LR) was performed on the slope values from each slice in the left I-O plot. Mean ± SEM. (WT, 1.92 ± 0.05, n = 86 slices, 19 mice; Tg, 2.10 ± 0.06, n = 97, 18; *p < 0.05). (B), Paired-pulse ratio of fEPSP responses. The ratio of the 2nd fEPSP slope (R2) to the 1st fEPSP slope (R1) was measured at the CA3-CA1 synapse of the hippocampal slice. WT, n = 85 slices, 19 mice; Tg, n = 94, 18; *p < 0.05 at the five intervals measured. Scale bars: 0.5 mV, 30 msec. (C-G), mEPSC properties. (C), Scale bars for all sample traces: 50 μA, 50 msec. (D), Measurements of amplitude. Mean ± SEM. (WT, 13.5 ± 0.2 pA; Tg, 15.1 ± 0.4 pA; **p < 0.001). (E), Frequency (WT, 1.87 ± 0.21 Hz; Tg, 1.91 ± 0.36 Hz; p = 0.92). (F), Rise time (WT, 1.66 ± 0.02 msec; Tg, 1.65 ± 0.03 msec; p = 0.74). (G), Decay time constant (WT, 2.36 ± 0.03 msec; Tg, 2.39 ± 0.04 msec; p = 0.57). The mEPSCs were measured from WT (n = 24 cells, 4 mice) and Tg mice (n = 22, 3).

