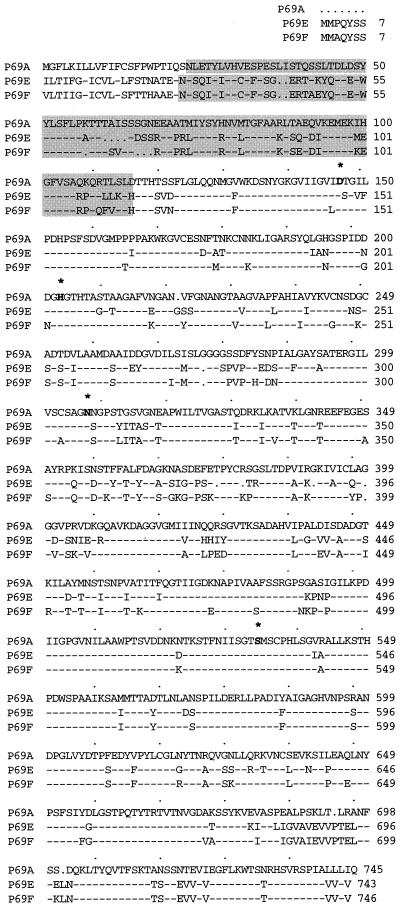
Figure 2.
Amino acid sequence alignment for the predicted P69E and P69F gene products. The sequence of P69A is shown in full and compared with the predicted ORFs of P69E and P69F. Dashes represent sequence identity. The catalytically important Asp, His, Asn, and Ser residues are shown in bold with an asterisk. Dots were introduced to maximize alignment. Amino acid residues of each protease are numbered from the precursor sequence. The propeptide domains are shaded.

