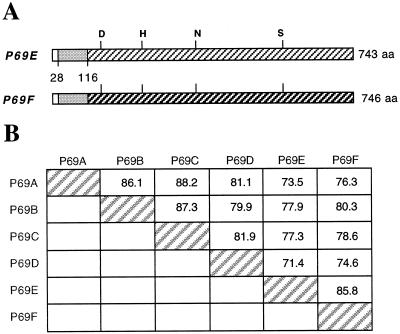
Figure 3.
Schematic representation of P69E and 69F preproenzyme structures and amino acid sequence homology to other P69-like proteases. A, The signal peptide, the propeptide, and the mature peptide region are shown by areas marked in white, gray, and cross-hatching, respectively. Numbers indicate positions of amino acid residues from the N terminus. The amino acids forming the catalytic triad in the active site (D, Asp; H, His; S, Ser) and the conserved N (Asn) residue are marked. B, Identity percentages between the different P69 proteases from tomato plants.

