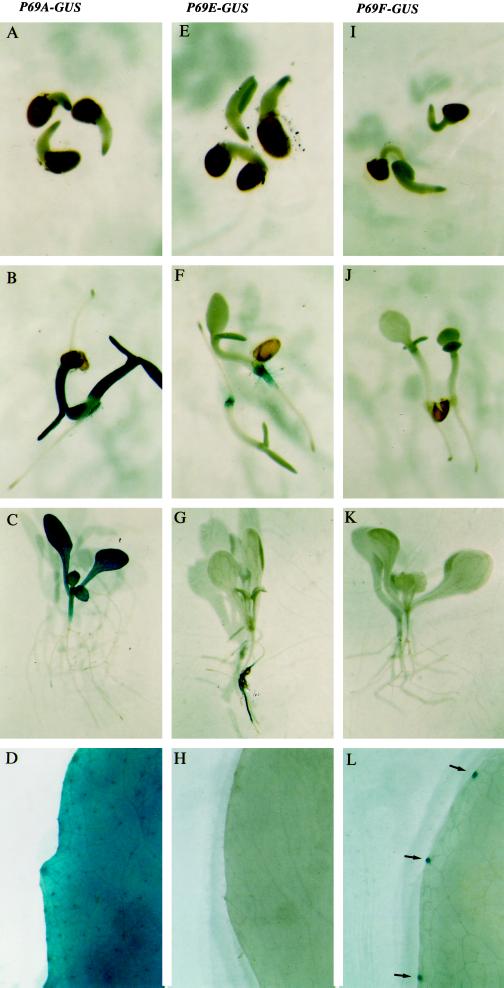
Figure 5.
Comparative GUS staining patterns of transgenic Arabidopsis plants harboring either P69A::GUS, P69E::GUS, or P69E::GUS gene fusions. A, E, and I, Four-day-old GUS-stained intact seedlings. B, F, and J, Ten-day-old GUS-stained intact seedlings. C, G, and K, Fifteen-day-old GUS-stained seedlings. D, H, and L, GUS staining of intact fully expanded leaves from 25-d-old plants. A, B, C, and D correspond to P69A::GUS transgenic plants. E, F, G, and H correspond to P69E::GUS transgenic plants. I, J, K, and L correspond to P69F::GUS transgenic plants. The arrows indicate the positions of hydathodes in a leaf sector of P69F::GUS transgenic plants.

