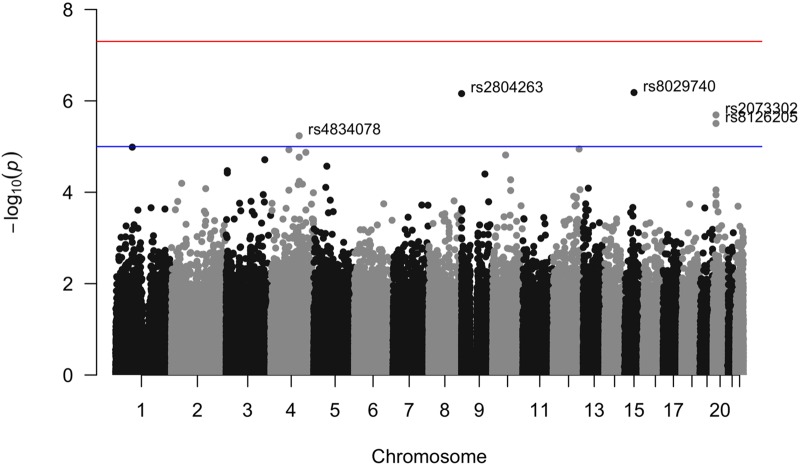
Fig 3. Manhattan plot of sibling variation in height among FHS 3rd generation sibling pairs.
Results for the pairwise sibling standard deviation in height regressed against the sibling-pair minor count of alleles with controls for sex of sibship, mean age of siblings, age difference of siblings, sibling mean height, parental genotype.

