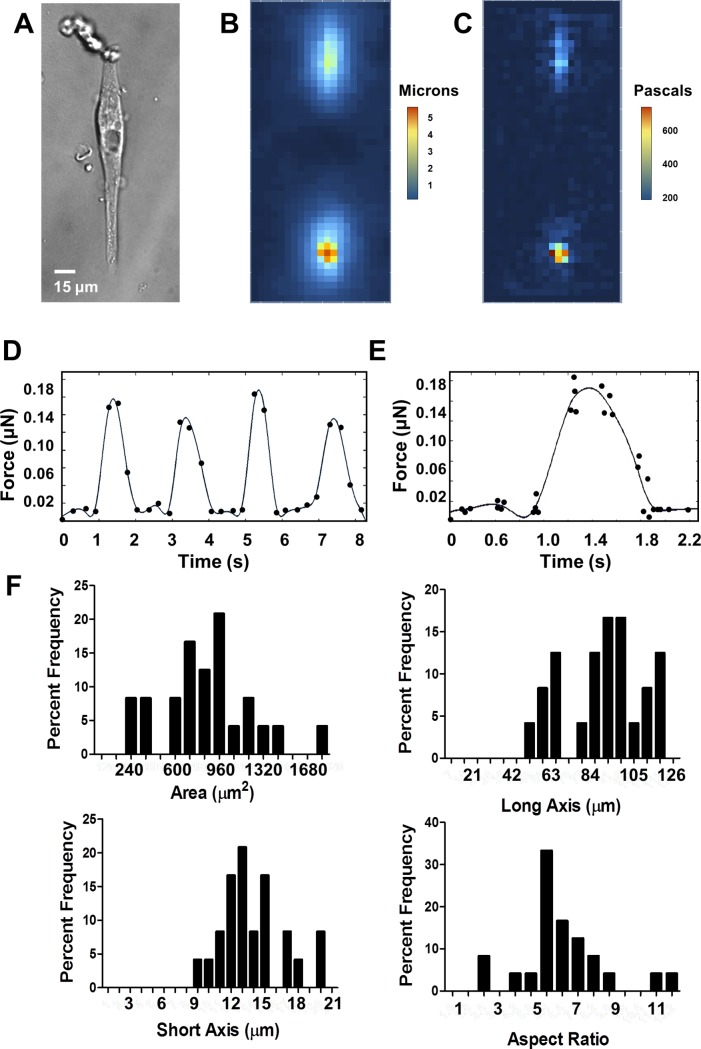
Fig 1. HiPSC-CMs and measurement of force by TFM.
A. Representative cell, 30 days post-differentiation on a 9.8 kPa substrate. B. Heat map showing magnitudes of deformation strain of the substrate under the representative cell. C. Heat map showing magnitudes of stress of the representative cell calculated from strain of the substrate. D. Total force of a single cell over time with respect to baseline at the point t = 0 seconds, over four contractions paced at 0.5 Hz, fitted with a smoothed spline curve. E. Total force of a single cell over time, average of four contractions, fitted with a smoothed spline curve. F. Histograms showing distribution of cell geometries.

