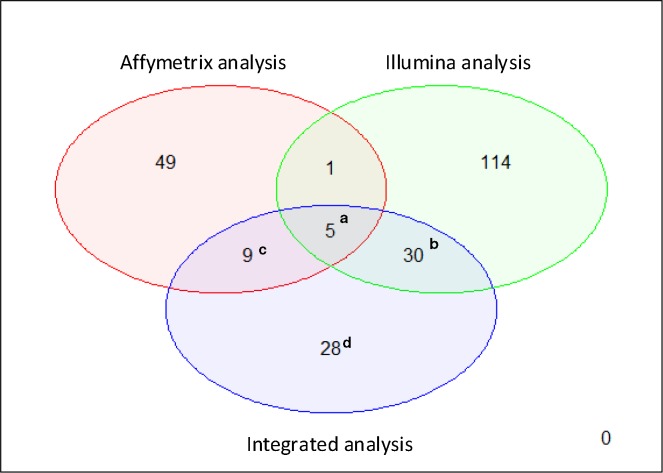
Fig 2. Comparison of individual analysis by technology with integrated analysis.
a Coincident genes in the three analyzes: Affymetrix, Illumina and integrated meta-analysis (Table 2). b Remaining differentially expressed genes in individual Illumina and the integrative meta-analysis (S1 Table). c Remaining differentially expressed genes in individual Affymetrix and the integrative meta-analysis (S2 Table). d Differentially expressed genes in the integrative meta-analysis but not in individual analysis (gained genes) (S3 Table).

