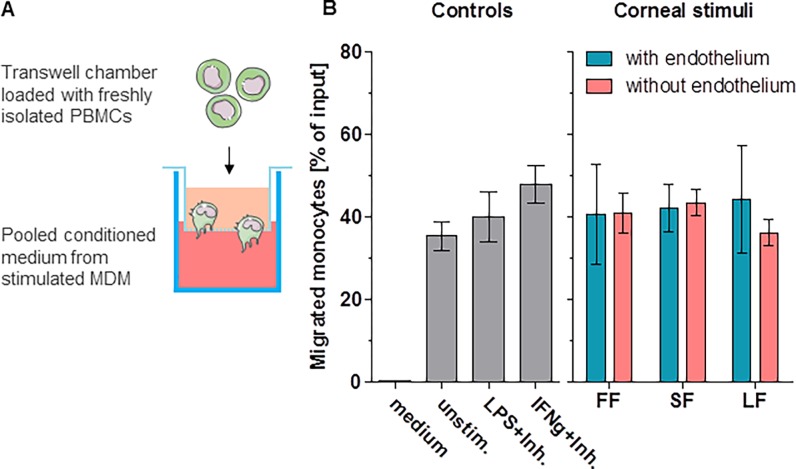
Fig 3. Migration analysis.
(A) Experimental setup for migration analysis. Wells were loaded with pooled supernatant from stimulated MDM. Freshly isolated PBMC were loaded into the upper chamber of transwell inserts. After three hours of migration, cells were identified and counted using FACS. (B) Results of the migration assays. Depicted is the percentage of migrated cells in relation to the total input. Corneal tissue used for MDM stimulation induced up-regulation of various cytokines (see Fig 1); supernatant from MDM with these cytokines induces monocyte recruitment.

