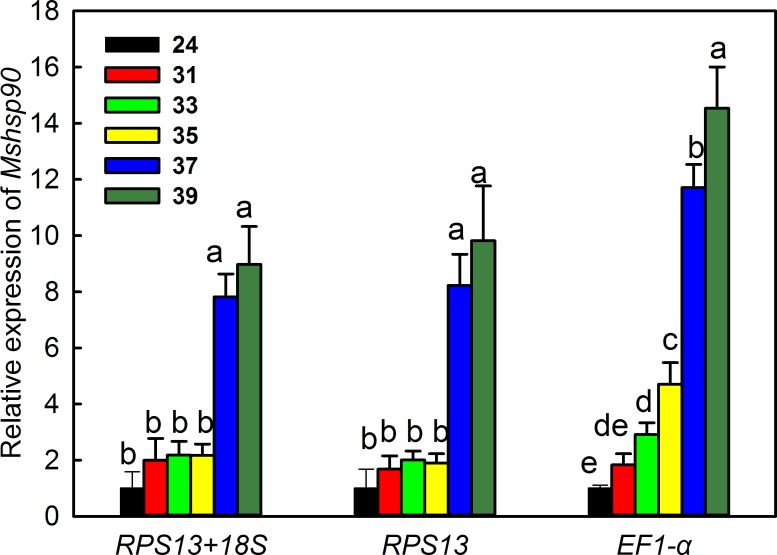
Fig 5. Relative expression of Mshsp90 during high temperature stress.
Relative expression is shown for Mshsp90 normalized with the most stable reference genes for high temperature stress (RPS13 and 18S) and the least stable gene, EF1-α. Columns represent mean expression at 24, 31, 33, 35, 37 and 39 oC, vertical bars show the SD of three replications, and columns labeled with different letters represent significant difference at P ≤ 0.05.

