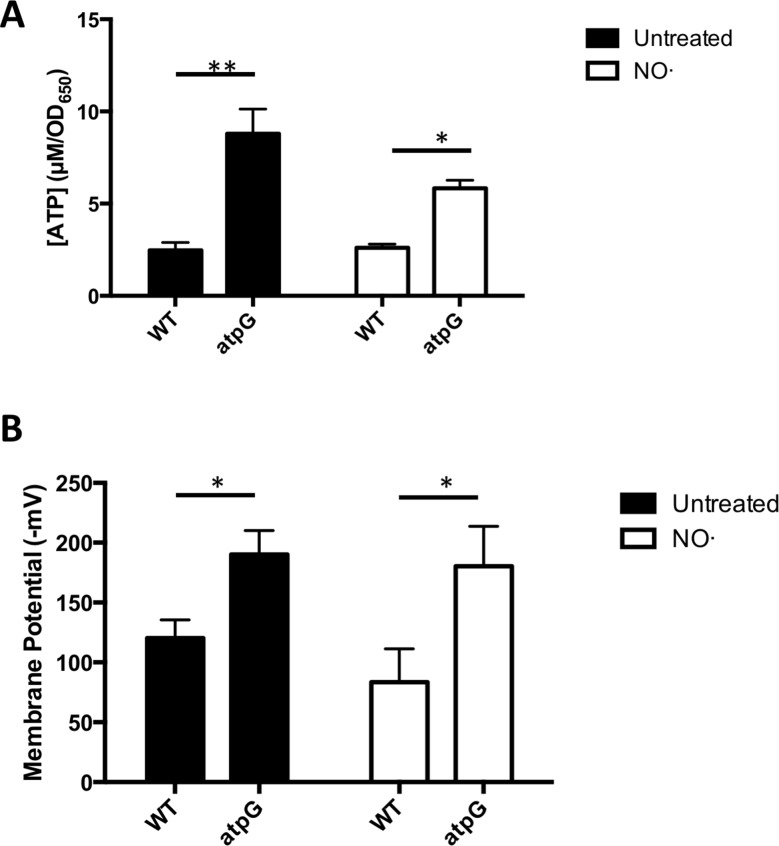
Fig 6. ΔatpG exhibits both elevated ATP levels and membrane potential both before and after NO· exposure.
S. aureus WT and ΔatpG were grown in TSB 5g/L glucose and were exposed to NO· mix (10mM NOC12, 1mM DEANO) at OD650 0.25. A. Prior to NO· addition and at 1-hr post addition ATP levels were determined. B. Prior to NO· addition and 1-hr post addition, membrane potential was quantified. (n = 2 for ATP levels, n = 3 for membrane potential). Significance was determined with two-sided Student’s t tests (*, P ≤ .05; **, P ≤ .01).

