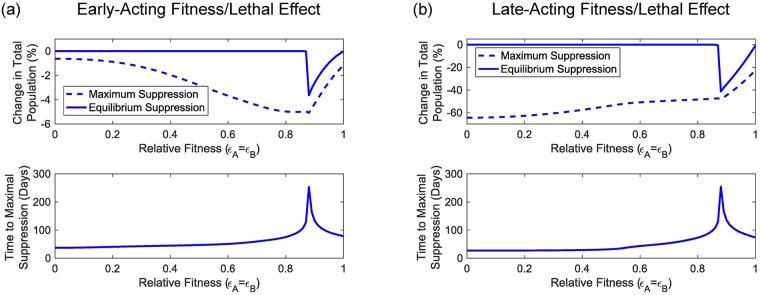
Fig 4. Initial adult mosquito population sizes have no impact on a number of key performance indicators for two-locus engineered underdominance gene drive.
Panels (a) and (b) show the impacts of early- and late-acting fitness/lethal effects whilst the different lines represent the general pattern for a given indicator. The top row shows both the maximal and equilibrium amount of population suppression for a two-locus engineered underdominance gene drive system whereas the bottom row shows the time taken for a system to reach maximal population suppression. We find no difference between examples for different values of α. As such, lines are results from a set of numerical simulations spanning the full range of relative fitness parameters (i.e. 0 ≤ ϵA,B ≤ 1) for a randomly selected α.

