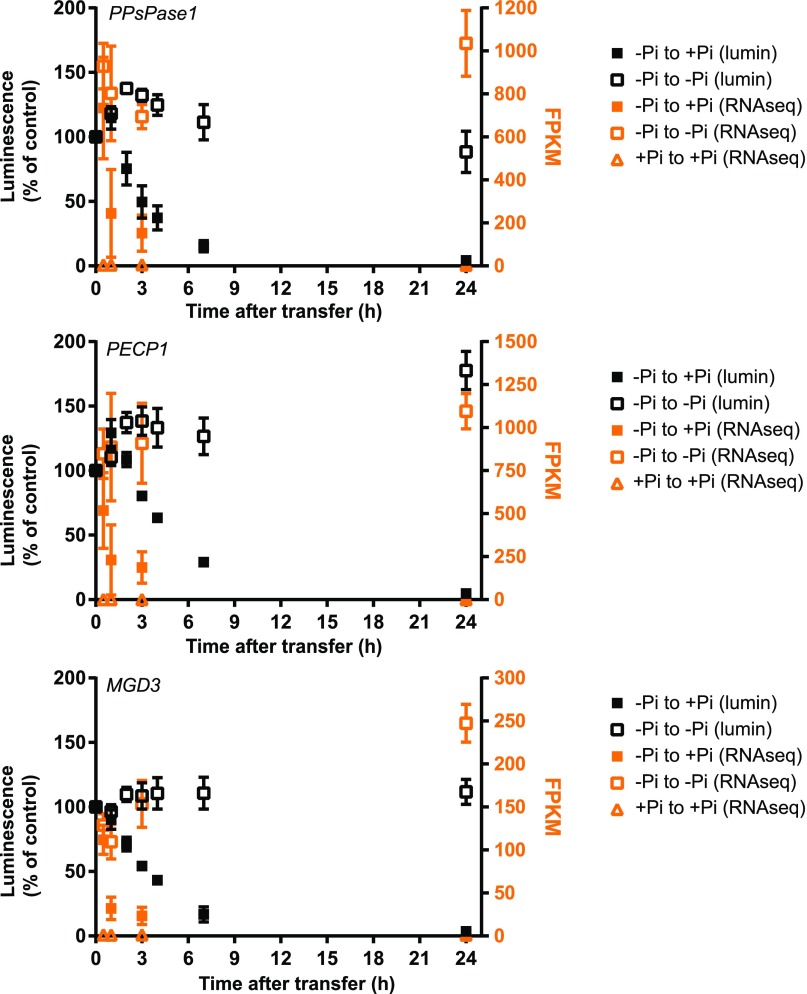
Figure 2.
Kinetics of transcript regulation following changes in Pi status for PPsPase1 (top panel) and PECP1 (middle panel). Results for MGD3 (bottom panel) were included as an example of strong regulation by Pi status. Data were acquired for the following time points: 30 min, 1 h, 3 h, and 24 h after transfer. The luminescence signal of whole seedlings (left axis, black data points) reflects the activity of corresponding Prom:LUC+ fusion and is expressed as a percentage of the luminescence detected in low Pi. Transcripts from root samples were directly quantified by RNA-seq (right axis, orange data points), with results expressed in FPKM. Samples transferred from low Pi to high Pi are represented by solid squares. Reference data (low Pi to low Pi and high Pi to high Pi transfers) are indicated by empty squares and triangles, respectively. Results shown are the mean ± sd of three biological replicates.

