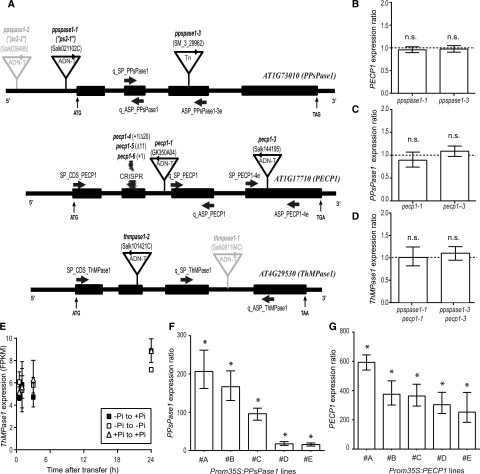
Figure 4.
Characterization of the knockout and overexpressing lines affecting PPsPase1, PECP1, and/or ThMPase1. A, T-DNA, transposon (Tn) and CRISPR-Cas9 (CRISPR) mutation localization within the targeted genes. Sequenced T-DNA and transposon borders are indicated by arrowheads. T-DNA insertions indicated in gray (ppspase1-2 and thmpase1-1) were published elsewhere and are not characterized here. Thick arrows indicate primer annealing sites. Start (ATG) and stop codons are indicated. Introns and exons are represented by thin and thick lines, respectively. The site of CRISPR mutations is also indicated. B to D, Levels of PECP1, PPsPase1, and ThMPase1 are similar in wild-type and knockout plants for PPsPase1 (B), PECP1 (C), or both (D), indicating a lack of transcriptional compensation. Results are expressed as gene induction level in mutants in comparison to wild-type plants grown under the same conditions. Wild-type control values were arbitrarily set to one (dotted line). E, ThMPase1 is expressed at low levels and does not respond to changes in Pi status for transcripts. Transcripts from root samples were quantified by RNA-seq, for the following time points: 30 min, 1 h, 3 h, and 24 h after transfer. Results are expressed in FPKM. Samples transferred from low Pi to high Pi are represented by solid squares. Reference data (low Pi to low Pi and high Pi to high Pi transfers) are indicated by empty squares and triangles, respectively. Results shown are the mean ± sd of three biological replicates. F and G, Lines that overexpress PPsPase1 (F) and PECP1 (G) show very high transcript levels for these phosphatases, even in the high Pi condition. Results are expressed as gene induction level in overexpressing lines (#A to #E) in comparison to wild-type plants grown under the same conditions. Wild-type control values were arbitrarily set to one. Results are presented as the median ± 95% confidence interval. Asterisks indicate a statistically significant difference (REST randomization test, P < 0.05). n.s., Nonsignificant. The reference genes used for the individual panels were ROC3, SCAMP, and GF14phi (B and C), or ROC3 only (D, F, and G).

