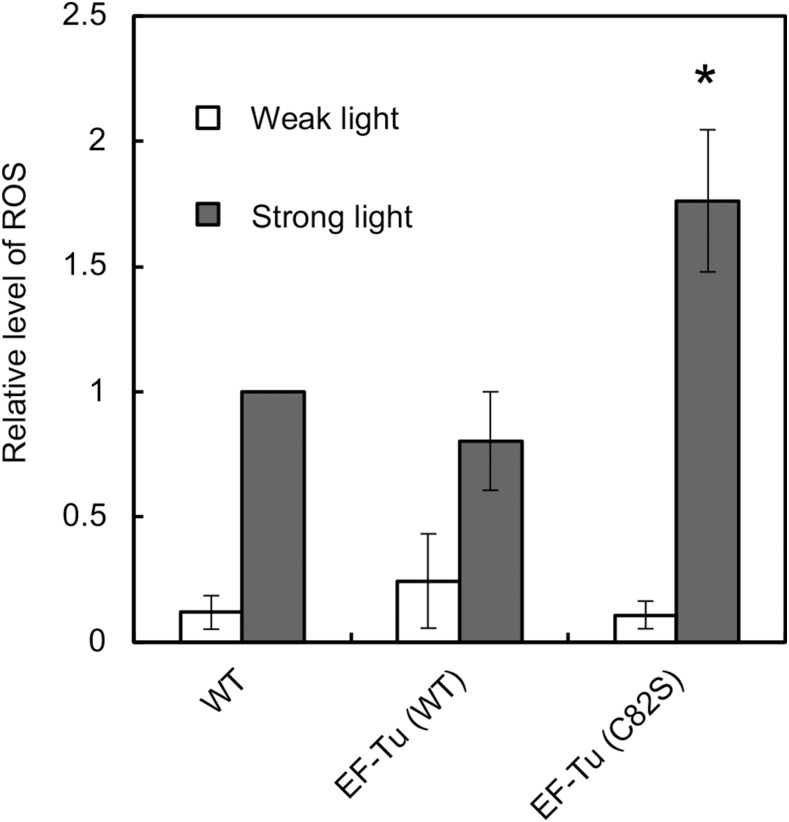
Figure 6.
Intracellular levels of ROS under strong light. Wild-type, EF-Tu (wild type), and EF-Tu (C82S) cells were exposed to weak light at 70 μmol photons m−2 s−1 (white bars) or strong light at 1000 μmol photons m−2 s−1 (gray bars) for 30 min in the presence of the fluorescent indicator carboxy-H2DCFDA. Fluorescence was normalized by reference to Chl fluorescence at 680 nm. The level of ROS in wild-type cells that had been exposed to light was taken as 1.0. Asterisk indicates statistically significant differences (P < 0.01; Student’s t test). WT, wild type.

