Figure 3.
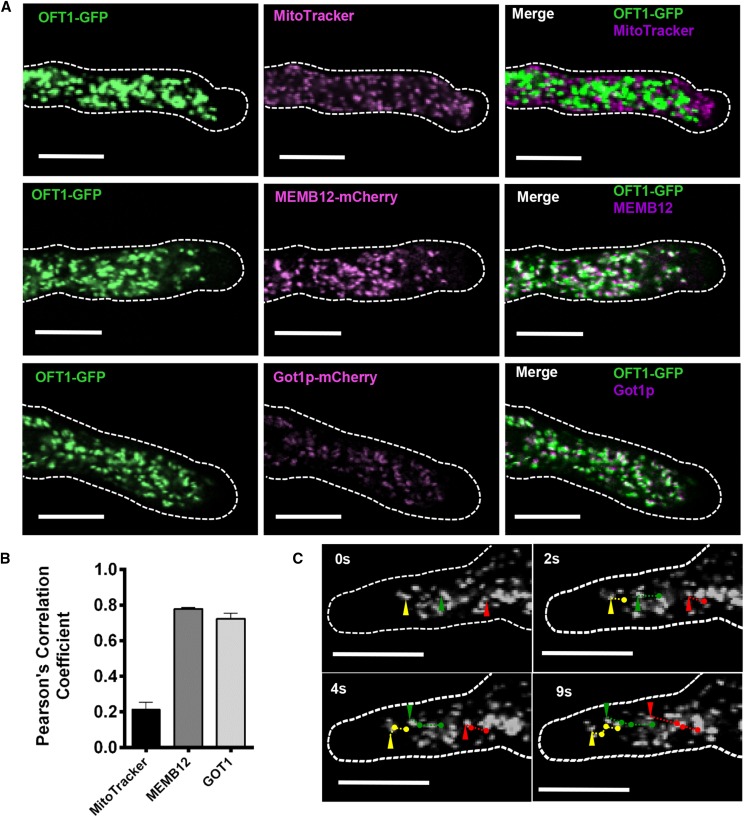
Subcellular localization of AtOFT1. A, Pollen tubes from 11p::OFT1-GFP-expressing plants stained with 500 nm MitoTracker Orange for 15 min (top row) and 11p::OFT1-GFP and MEMB12- or GOT1-mCherry- (Geldner et al., 2009) coexpressing plants (middle and bottom rows, respectively). Pollen tubes were germinated as described above and visualized by confocal microscopy. The outline of each pollen tube is shown as a dashed white line. OFT1-GFP (left column; green signal), the colocalization marker (middle column; magenta signal), and the merge of each image set (right column; white signal) are shown. Bars = 10 µm. B, Quantitative colocalization analysis of each image set was performed using JACoP (Bolte and Cordelières, 2006), and the Pearson correlation coefficient between OFT1-GFP and MitoTracker (black bar), MEMB12-mCherry (charcoal bar), or Got1p-mCherry (gray bar) was calculated. Data are means ± se (n = 6–15 independent images per colocalization marker). C, Live-cell confocal imaging of OFT1-GFP subcellular localization in a growing pollen tube over time. The outline of the pollen tube is indicated with a dashed white line. Image time points are indicated in the top left corner of each image. The trajectories of three representative particles are indicated individually at their current position for each indicated time point by green, red, and yellow arrowheads, and their corresponding trajectories in successive images are indicated with green, red, and yellow lines, respectively. Scale bars represent 10 μm.

