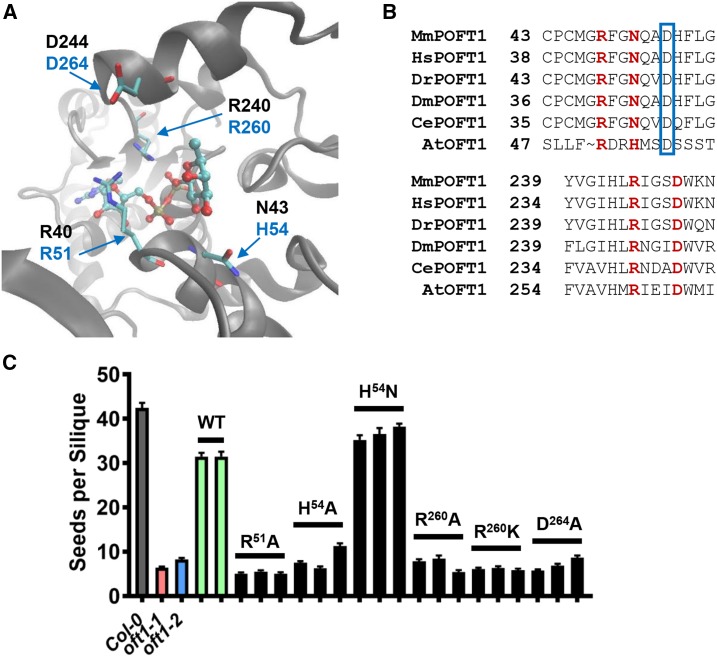
Figure 7.
Structure-function analysis of AtOFT1 putative catalytic residues. A, The active site of C. elegans POFT1 bound to GDP-Fuc (Protein Data Bank identifier 3ZY5) is shown, with critical catalytic residue indices in black font and the corresponding AtOFT1 residues shown in blue font. B, Sequence alignments of the AtOFT1 N-terminal (top) and C-terminal (bottom) regions compared with multiple metazoan POFT1s. Critical catalytic residues are highlighted in red, and the beginning residues for each alignment segment are indicated for reference. An Asp residue used to propose an alternative alignment of the N-terminal domain is boxed in blue. C, Seed set in oft1-1 plants expressing the indicated site-directed mutant constructs of AtOFT1 (black bars). The seed set of Col-0 (gray bar), oft1-1 (red bar), oft1-2 (blue bar), and oft1-1 lines expressing wild-type AtOFT1 (WT; green bars) is shown for reference. Data are means ± se (n = 29–71).

