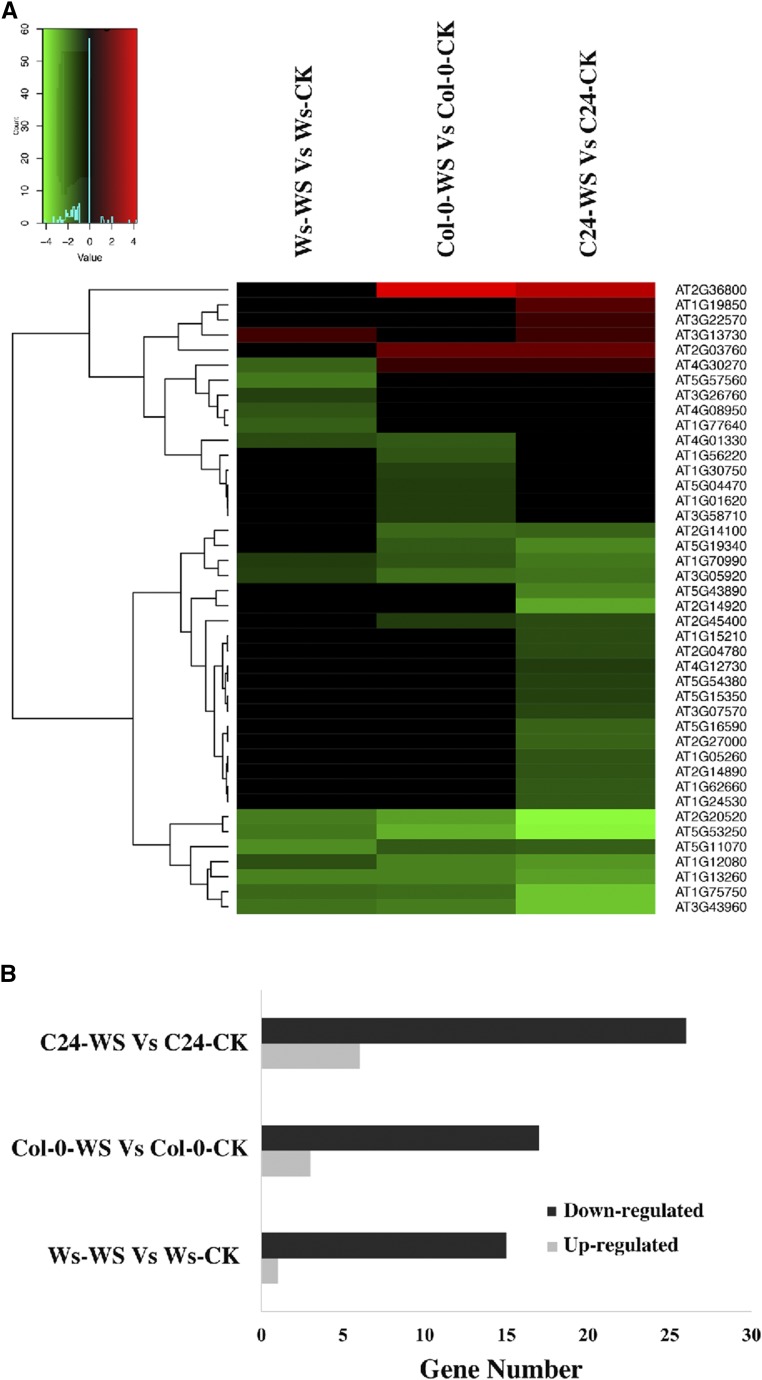
Figure 5.
Identification of BR-related genes in root hydrotropism. A, Heat map chart derived from hierarchical cluster analysis of BR-related genes that were differentially regulated in our microarray results. Each row represents a gene, and each column indicates Ws-WS versus Ws-CK, Col-0-WS versus Col-0-CK, and C24-WS versus C24-CK. Red and green indicate up- and down-regulation compared with the control, respectively, while black indicates no change. B, Number of BR-related genes in Ws-WS versus Ws-CK, Col-0-WS versus Col-0-CK, and C24-WS versus C24-CK. Down-regulated and up-regulated genes are shown in black and gray, respectively.

