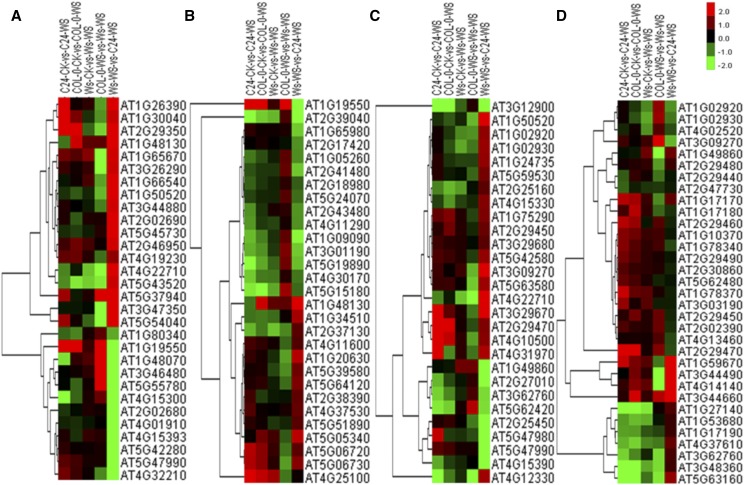
Figure 7.
Cluster analyses of eDTGs involved in Ws-specific pathways. eDTGs involved in peroxidase activity (A), oxidoreductase activity (B), antioxidant metabolism (C), and transferase activity (D) are shown. Red indicates up-regulation of genes, green indicates down-regulation of genes, and black indicates a lack of significant expression change.

