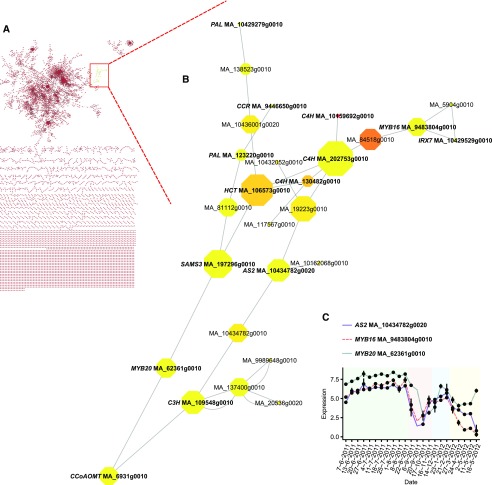
Figure 5.
A subnet in the coexpression network connects several gene models related to cell wall formation and especially the monolignol pathway. A, Location of the subnet in the coexpression network. B, Gene cluster containing several cluster 1 lignin biosynthetic genes. The size of the octagons represents the betweenness centrality value, while the color denotes neighborhood connectivity (ascending from yellow to red). Double links indicate bidirectional edges. C, Expression profiles of the TF genes implicated in the seasonal control of lignification. Values are means ± se.

