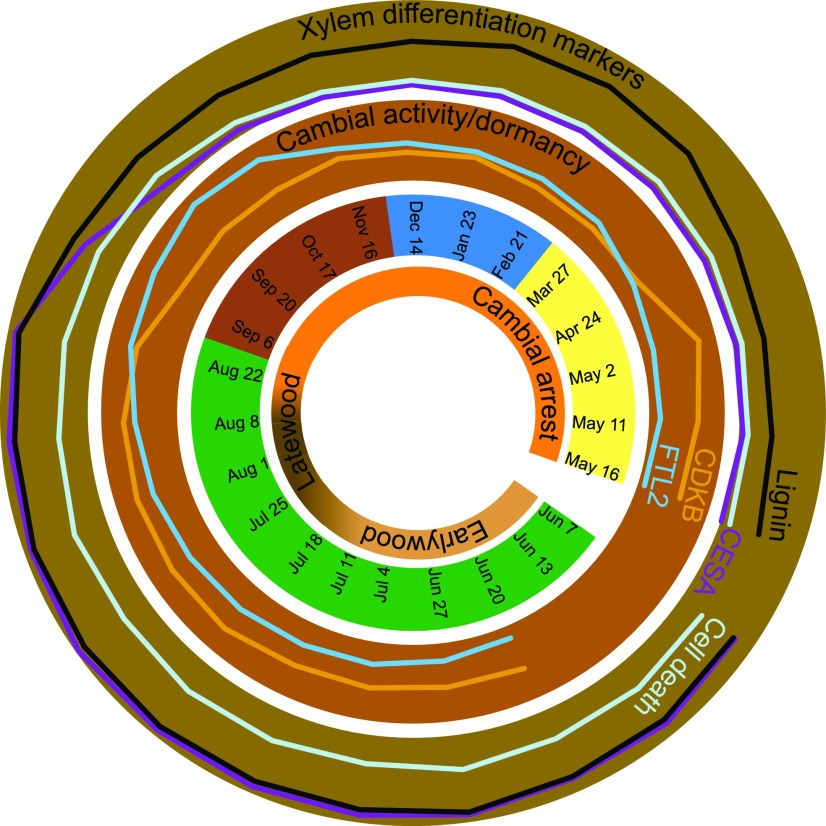
Figure 9.
Marker genes define the main phase transitions during the annual cycle of cambial growth in Norway spruce. The outermost and second outermost rings indicate the transcript abundances in xylem and cambium/phloem samples, respectively. The profiles represent the means of the specific gene groups.

