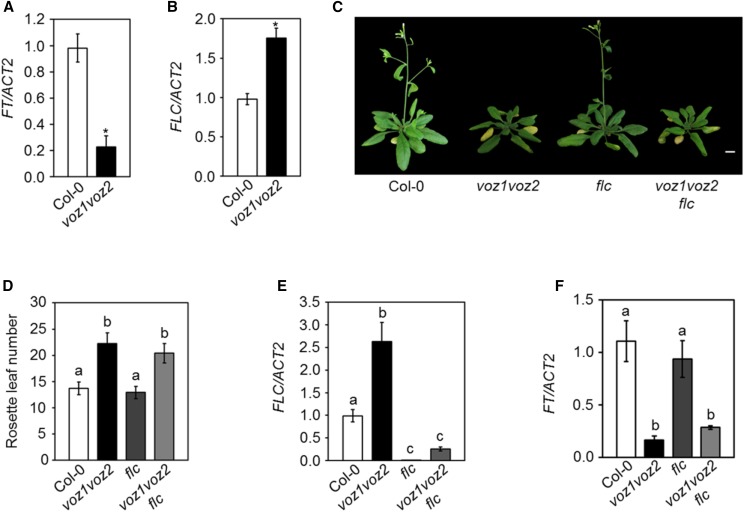
Figure 2.
VOZ1 and VOZ2 regulate flowering independently of FLC. A and B, Relative transcript levels of FT (A) and FLC (B) analyzed by RT-quantitative PCR (qPCR). Asterisks indicate significant differences from Col-0 (P < 0.001, unpaired Student’s t test). C, Five-week-old plants of the indicated genotypes under LDs. Bar = 1 cm. D, Number of rosette leaves at bolting of the indicated genotypes under LDs. Data are shown as means ± sd (n = 15). Letters shared between the genotypes indicate no significant difference (P < 0.001, one-way ANOVA, Tukey’s multiple comparison test). E and F, Relative transcript levels of FLC (E) and FT (F) analyzed by RT-qPCR. Letters shared between the genotypes indicate no significant difference (P < 0.05, one-way ANOVA, Tukey’s multiple comparison test). For RT-qPCR, total RNA was isolated at zeitgeber time (ZT)-16 (A and F) and ZT-8 (B and E) from 14-d-old seedlings grown under LDs. RNA extraction was performed three times independently. The transcript levels were normalized to ACTIN2 (ACT2). Data are shown as means ± sd (n = 3).

