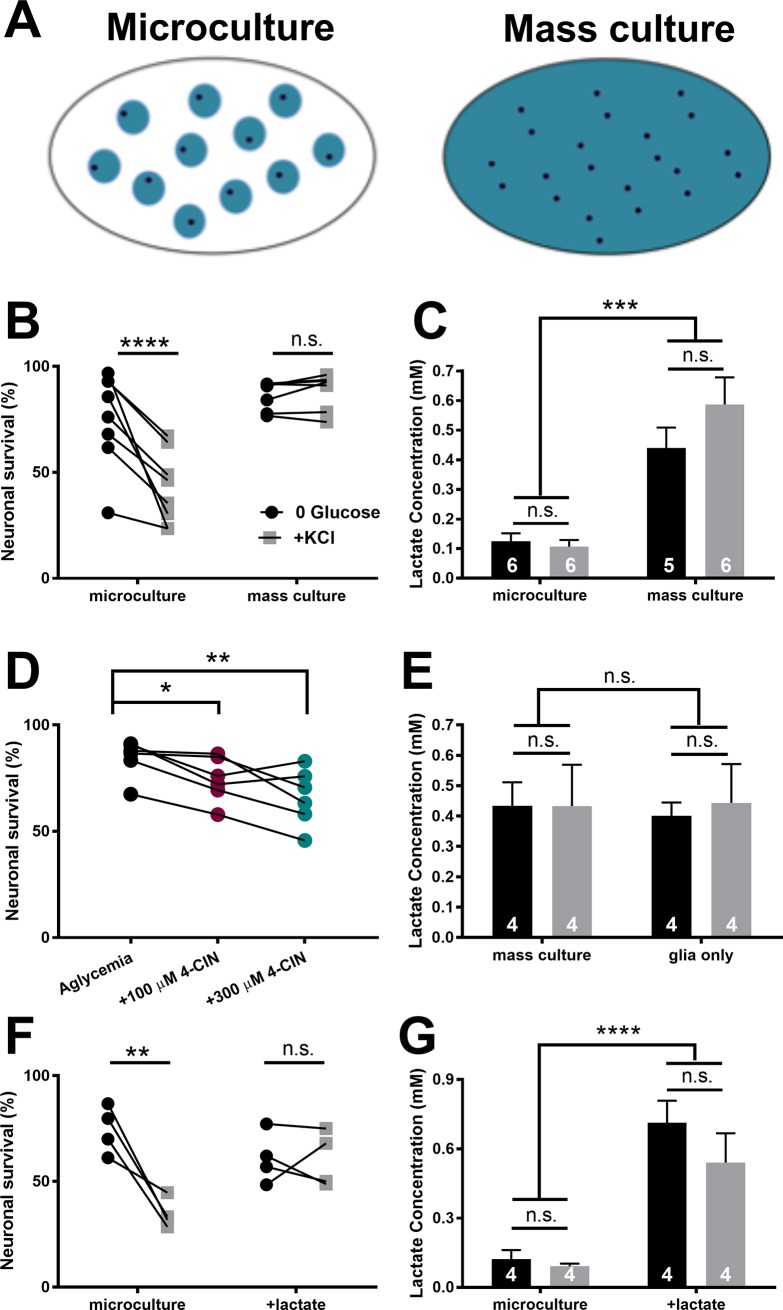
Fig 5. Ongoing, global lactate release supports neuronal resilience to glucose deprivation.
(A) Schematic of microcultures and high-density mass cultures. Compared with mass cultures (right), microcultures (left) typically contain fewer neurons (black dots) and fewer astrocytes overall (blue circles), but with similar local density of astrocytes [38]. (B) Survival of microcultures and mass cultures, incubated in either glucose-free saline (0 glucose, black dots) or in glucose-free depolarizing saline (+KCl, gray dots). Lines connect sibling cultures. Two-way ANOVA with repeated measures for depolarization state showed a significant interaction between culture condition and depolarization state (p < 0.001). Results of post-hoc, Bonferroni-corrected multiple comparisons are indicated above symbols. (C) Summary of lactate concentrations measured from microcultures and mass cultures following prolonged incubation in glucose-free saline (black bars) or glucose-free depolarizing saline (gray bars; Two-way ANOVA with no significant difference between glucose deprivation ± KCl and p < 0.001 between microculture and mass culture). (D) 4-CIN induces neuronal loss in mass cultures at both 100 μM (teal dots) and 300 μM (burgundy dots). Lines connect sibling cultures. One-way repeated measures ANOVA with Dunnett’s multiple comparisons test with glucose deprivation as control. (E) Lactate concentration measured in mass cultures in the absence of neurons does not differ from that measured in the presence of neurons. Black bars indicate prolonged glucose deprivation and gray bars indicate prolonged depolarizing glucose deprivation (+KCl; p > 0.05, Two-way ANOVA). (F) Summary of neuronal survival for microcultures incubated in glucose-free saline with or without 0.35 mM lactate added to mimic mass culture lactate. Two-way ANOVA with repeated measures for depolarization state revealed a significant interaction between lactate and depolarization state (p < 0.05). Results of post-hoc Bonferroni corrected multiple comparisons are indicated above symbols. (G) Summary of lactate concentrations measured from microcultures with or without added lactate, confirming persistence of lactate addition (Two-way ANOVA with no significant difference between glucose deprivation ± KCl and p < 0.0001 between microculture ± lactate). Data are represented as mean ± SEM. *p<0.05. **p<0.01. ***p<0.001. ****p<0.0001. n.s., non-significant.

