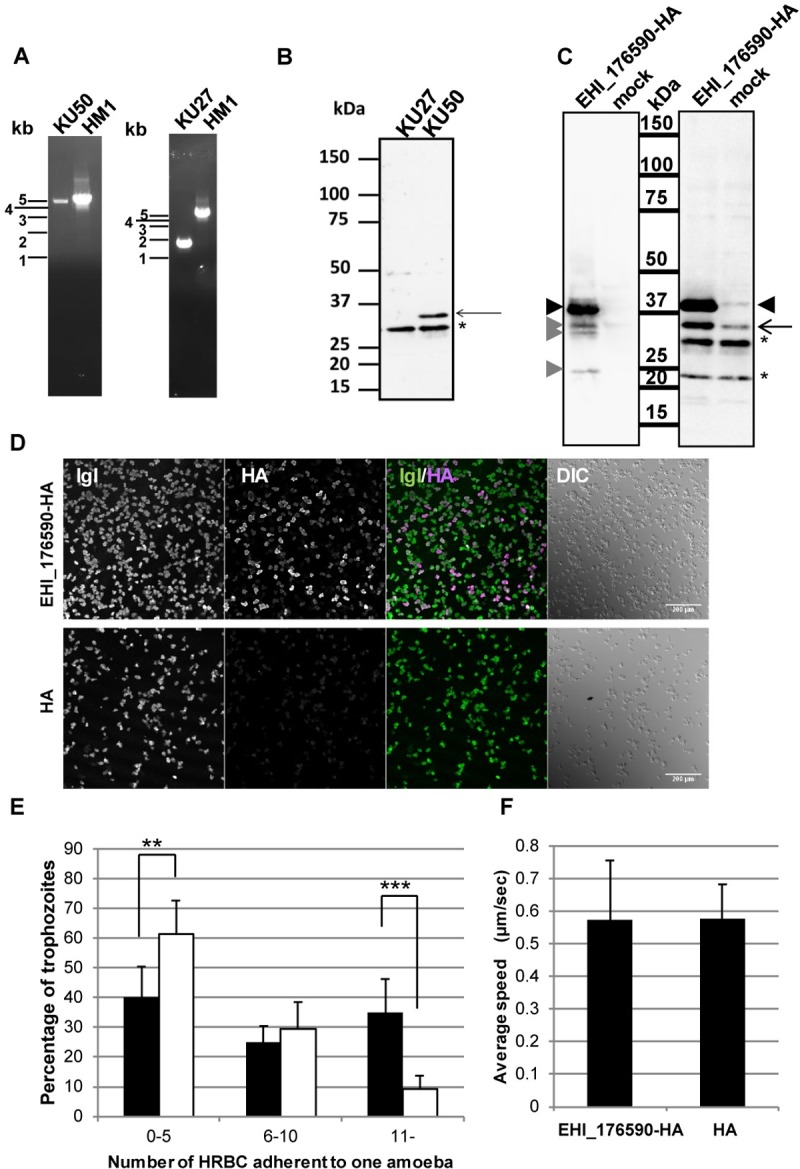
Fig 3. Verification of the loss of EHI_176590 in KU27, overexpression of EHI_176590, and phenotypes caused by EHI_176590 overexpression.

(A) Verification by PCR of the lost genomic region, containing the EHI_176590 gene, in KU27. (B) Immuno-detection of EHI_176590 in KU27 and KU50. Total cell lysates, from the indicated strains, were analyzed by immunoblot analysis with anti-EHI_176590 antibody. The arrow depicts the EHI_176590 protein, which is present in KU50, but missing in KU27; asterisk indicates the protein band detected by non-specific binding or cross reaction. (C) Immuno-detection of EHI_176590-HA. Total lysates from EHI_176590-HA-expressing and mock transformants were analyzed by immunoblot analysis with an anti-HA antibody (left panel) or anti-EHI_176590 antibody (right panel). Black arrowheads indicate full-length EHI_176590-HA, and gray arrowheads indicate minor truncated forms of EHI_17690-HA. The arrow indicates intrinsic EHI_176590. Asterisks depict protein bands detected by non-specific binding or cross reaction. (D) Low magnification confocal immunofluorescence images of the EHI_176590-HA-expressing and mock-transfected transformants. Trophozoites were fixed and reacted with anti-Igl and anti-HA antibodies. Merged fluorescent (IGL/HA) and differential interference contrast (DIC) images are also shown. (E) Increased adherence to HRBCs by EHI_176590 overexpression. EHI_176590-HA-expressing (filled bars) and mock (open bars) transformants were co-cultured with HRBCs on ice for 30 min, and the number of adherent HRBCs per ameba were counted. The total number of trophozoites was set to 100% and the percentages of trophozoites, bound to 0–5, 6–10, or >10 HRBCs, are shown. Error bars indicate standard deviations of four biological replicates (2292 and 1762 trophozoites were counted for the EHI_176590-HA-expressing and mock transformants, respectively). **p-value <0.01, ***p-value <0.001 (F) Cell motility of the EHI_176590-HA-expressing and mock-transfected transformants. Time-lapse images of CellTracker Green-loaded EHI_176590-HA-expressing and mock (“HA”) transformants were analyzed by ICY software to measure cell motility. The average speed and standard deviation of the motility of EHI_176590-HA and mock vector transformants (HA) are shown; 135 and 106 trophozoites, respectively, were monitored in four independent experiments.
