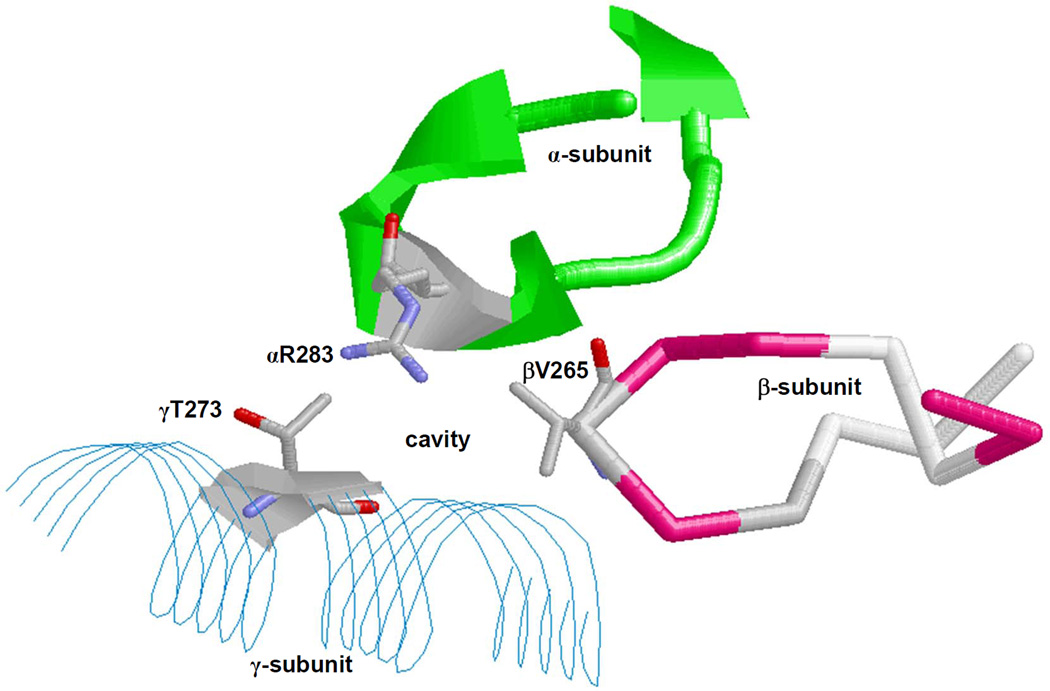
Fig. 3. X-ray crystallographic structure of the polyphenol binding pocket of F1Fo ATP synthase.
α-, β-, and γ-subunits forming an inhibitor binding cavity are shown. Some residues, including αArg-283, are identified. The figure was generated by PDB file 2JJ1 [11] using RasMol software. Residue numbers are based on E. coli numbering.

