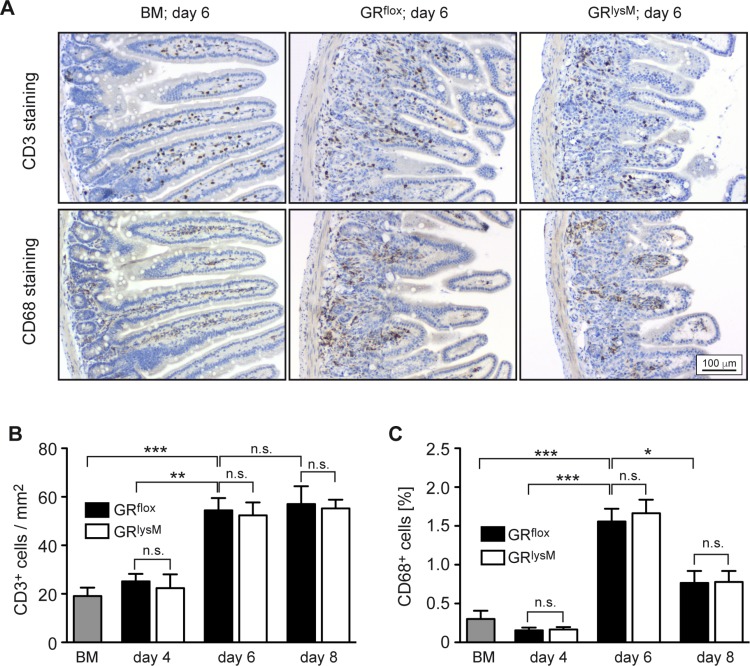
Figure 5. Immunohistochemical assessment of the jejunum in the early phase of aGvHD in the GRlysM model.
GRflox and GRlysM BALB/c mice were transplanted with BM and purified T cells from C57BL/6 wildtype mice; transfer of BM cells only served as a control. Mice were sacrificed and analyzed on day 4, 6 and 8 after aGvHD induction; analysis of BM controls was performed on day 6. (A) Representative microphotographs of sections of the jejunum collected on day 6 from BM control and aGvHD mice and stained with antibodies recognizing CD3 (upper panel) or CD68 (lower panel). Size bar: 100 µm. (B) Numbers of CD3+ cells per mm2 were determined by computer-aided counting of stained cells in jejunum sections from all experimental groups using ImageJ software. N = 7 (BM), N = 5/5 (GRflox/GRlysM; day 4), N = 20/21 (GRflox/GRlysM; day 6), N = 6/7 (GRflox/GRlysM; day 8); data pooled from multiple experiments. (C) CD68+ cells were enumerated in jejunum sections from all experimental groups by measuring the percentage of stained area using ImageJ software. N = 6 (BM), N = 5/5 (GRflox/GRlysM; day 4), N = 20/20 (GRflox/GRlysM; day 6), N = 6/7 (GRflox/GRlysM; day 8); data pooled from multiple experiments. All values are depicted as mean ± SEM. Statistical analyses were performed by Mann-Whitney U test (*p < 0.05; **p < 0.01; ***p < 0.001; n.s.: non-significant).

