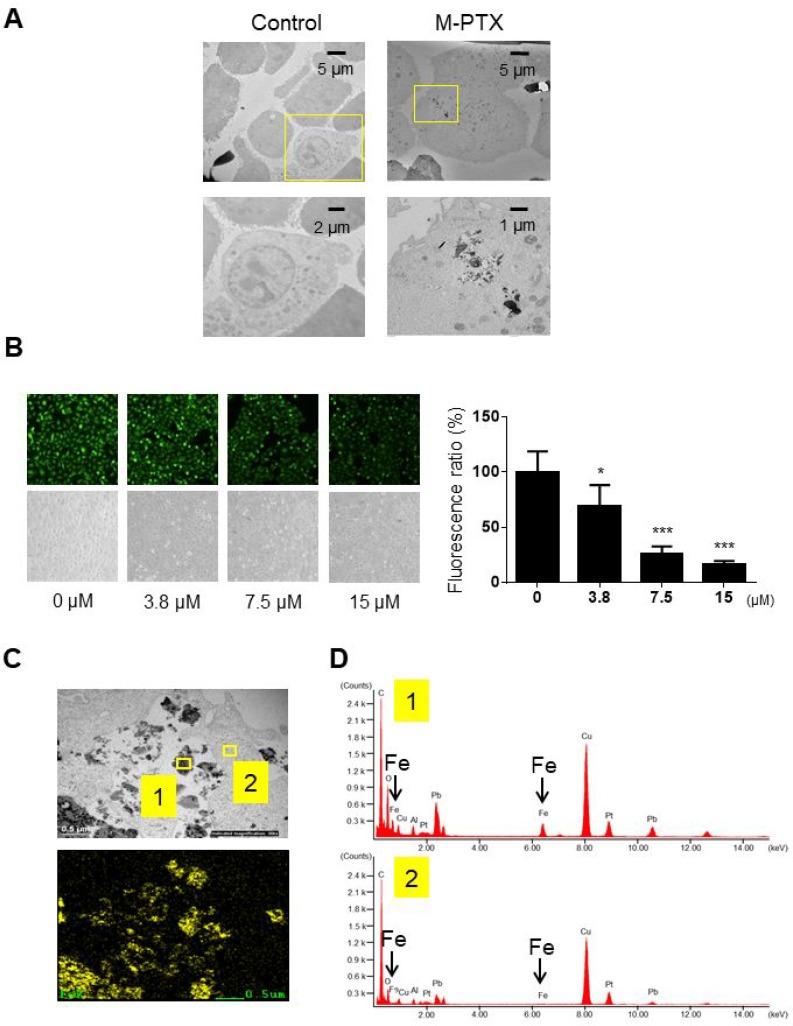
Figure 2. Cellular uptake of M-PTX NPs in human squamous cell carcinoma.
(A) Cellular uptake of M-PTX NPs was analyzed by transmission electron microscopy (TEM) and energy-dispersive X-ray (EDX) spectroscopy in OSC-19 cells. (left) TEM of control cells, (right) TEM of cells after incubation with 30 μM M-PTX NPs. Calibration bars (5 (upper), 2 (left lower) and 1 (right lower) µm) are shown. Note that cells were shrunken and vacuolated in the presence of M-PTX NPs, indicative of apoptotic cell death. (B) Representative images of calcein using a fluorescence microscope and optical microscope. Ratios of calcein fluorescence are shown below (n = 4, *p < 0.05, ***p < 0.001 vs. control). Note that cellular fluorescence was decreased in the presence of M-PTX. (C) M-PTX NPs in a high-power field of TEM. Yellow boxes indicate M-PTX NPs and cytoplasm, which were analyzed by EDX in (D). The calibration bar (500 nm) is shown. (D) Spectrum analysis of M-PTX NPs by EDX. Yellow box #1 (M-PTX NPs) in (C) showed the peaks of iron, while yellow box #2 (cytoplasm) did not. Arrows indicate specific peaks of iron.

